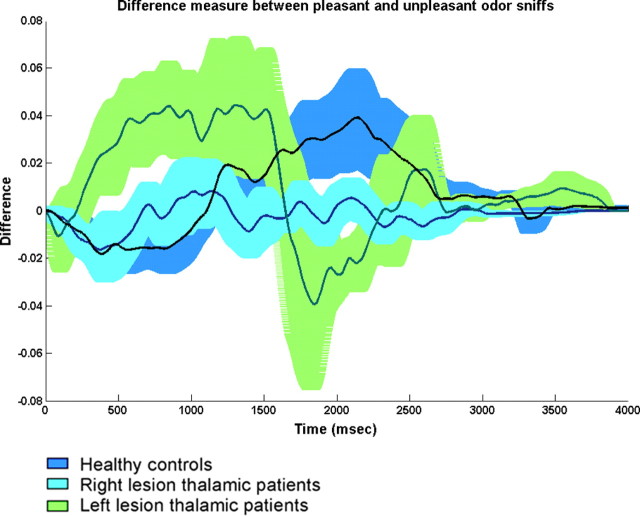
Figure 6.
Difference measurement between sniffs for pleasant and unpleasant odorants. Means and SE bars are plotted (blue, control group; cyan, right thalamic lesioned patients; green, left thalamic lesioned patients). Whereas healthy controls and left thalamic patients took longer sniffs of pleasant than unpleasant odorants, right thalamic patients took equal sniffs of pleasant and unpleasant odorants.

