Figure 1.
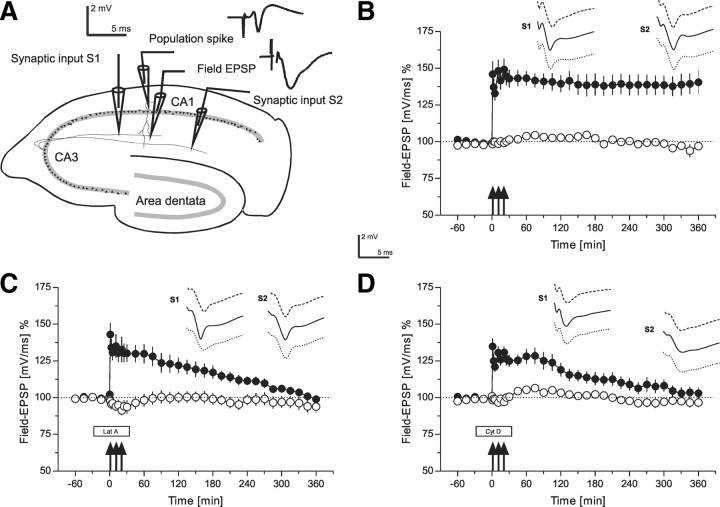
The role of the actin network in long-term potentiation, i.e., late-LTP (time courses of field EPSP recordings). A, Schematic representation of a transversal rat hippocampal slice with electrode locations to stimulate two separate synaptic inputs S1 and S2 in stratum radiatum of the CA1 region. The location of recording electrodes for the PS as well as the field EPSP from a single, stimulated neuronal population are provided. The analog traces are representative examples of recorded potentials. B, The time course of the slope of the field EPSP after induction of late-LTP in S1 by STET (filled circles; tetanization are symbolized as arrows) is shown. Open circles represent recordings from the control synaptic pathway S2 (n = 7). C, Induction of late-LTP in the presence of the actin polymerization inhibitor latrunculin A (box Lat A). Latrunculin A was applied 30 min before STET (3 arrows) of S1 (filled circles; wash-out of the drug: 30 min after the first tetanization; open circles control input; n = 7). D, Induction of late-LTP of synaptic input S1 (filled circles) in the presence of actin polymerization inhibitor cytochalasin D (n = 7). Cytochalasin D (box Cyt D) was applied 30 min before STET, and it was washed-out 30 min after the first tetanization (open circles: control input S2). Analog traces represent typical field EPSPs 30 min before the normal time point of tetanization (dashed line); 30 min (solid line), and 6 h (dotted line) after tetanization of input S1. The analog traces for S2 were recorded at the same time points, however, without tetanization. Calibration: 2 mV, 5 ms. Arrows indicate the time point of tetanization of synaptic input S1 (STET are symbolized as 3 arrows). Filled boxes represent drug application. Lat A, latrunculin A; Cyt D, cytochalasin D.

