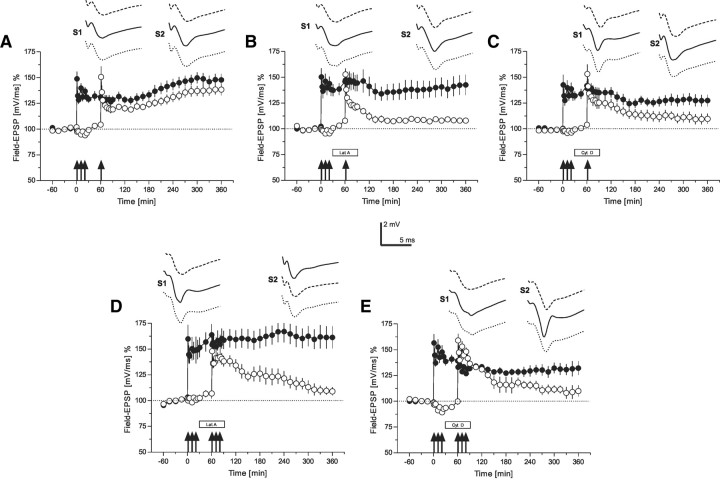
Figure 3.
The role of the actin network for synaptic tagging (time courses of field EPSP recordings)—“strong-tetanization before weak-tetanization” and “strong before strong.” A, This panel represents a control experiment verifying synaptic tagging in our preparation. The time course of the slope of the field EPSP after STET of input S1 (filled circles; the tetanization is symbolized by the arrows) is presented. One hour after STET to S1, a WTET to S2 (open circles) was applied. The normally induced early-LTP in S2 was transformed into late-LTP by the previous induction of late-LTP in S1 (n = 7). B, The time course of the same tagging experiment as in A is presented, however, with the application of latrunculin A during the time of WTET to S2 (open circles; box represents drug application). Latrunculin A was applied 30 min before and until 30 min after WTET of S2 (n = 7). Synaptic tagging in S2 was thus prevented. C, A similar experiment as in B; however, instead of latrunculin A, now cytochalasin D was applied (n = 7). Again, synaptic tagging in S2 was prevented by the drug. D, The same procedure as in B; however, now STET was also applied to S2 (open circles) in the presence of latrunculin A (n = 6). Late-LTP in S2 was also prevented by the drug regardless of the previous STET and induction of late-LTP in S1 (filled circles). E, The same procedure as in D with the exception that instead of latrunculin A now cytochalasin D was applied (n = 6). Again, late-LTP in S2 was prevented. The time points of the analog traces as in Figure 1; however, here S2 was also tetanized. Therefore, the traces of S1 and S2 represent representative examples 30 min before (dashed line), 30 min (solid line), and 6 h (dotted line) after tetanization of the adequate input. Symbols and calibration as in Figure 2.

