
Figure 3.
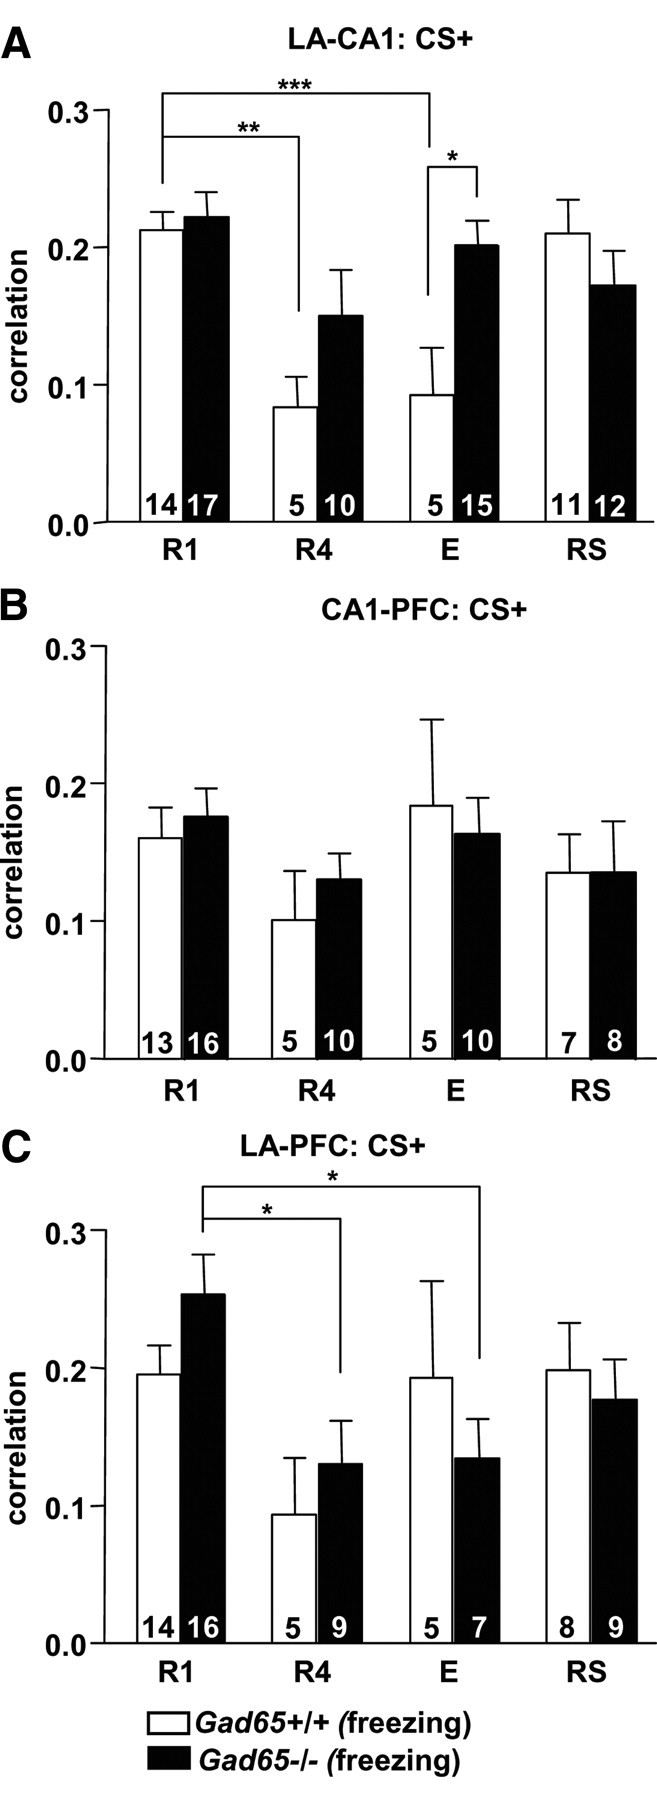
Theta synchronization deficits in Gad65−/− mice during fear extinction. Average cross-correlation values for the second positive peak during freezing during the CS+ between the LA and CA1 (A), CA1 and PFC (B), and LA and PFC (C). Gad65+/+ mice showed significantly decreased LA–CA1 correlation values during R4 and E when compared with R1. Gad65−/− mice did not display this decrease, with the correlation values remaining high across extinction training and being significantly higher than for Gad65+/+ littermates during E. LA–PFC correlation values significantly decreased in Gad65−/− mice during R4 and E when compared with R1 but were not significantly different than for Gad65+/+ littermates during any session. All data are expressed as mean ± SEM. Numbers within each bar indicates the number of observations. *p < 0.05, **p < 0.01, ***p < 0.001.