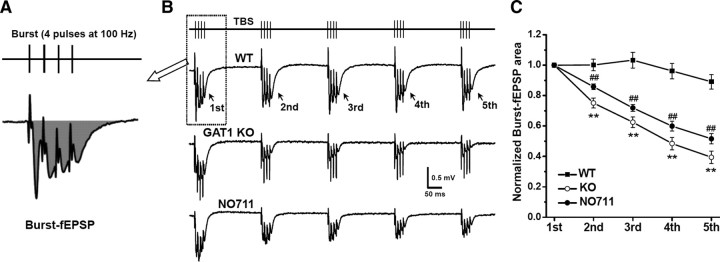
Figure 3.
GAT1 disruption progressively suppressed burst-induced fEPSPs during TBS. A, Burst-induced fEPSPs were measured as the total fEPSP area marked in shadow. B, Typical burst-fEPSP recordings in slices from GAT1 KO mice, or slices from WT mice in the absence or presence of NO711 (20 μm). Note the progressive decline of the burst-fEPSPs during TBS after GAT1 disruption. C, Normalized burst-fEPSP areas for data from B (n = 12 for each group). Each burst-fEPSP was normalized to the first one. **p < 0.01 for the second, third, fourth, and fifth burst, compared between WT and GAT1 KO groups; ##p < 0.01 for the second, third, fourth, and fifth burst, compared between WT and WT plus NO711; Student's t test.

