
Figure 4.
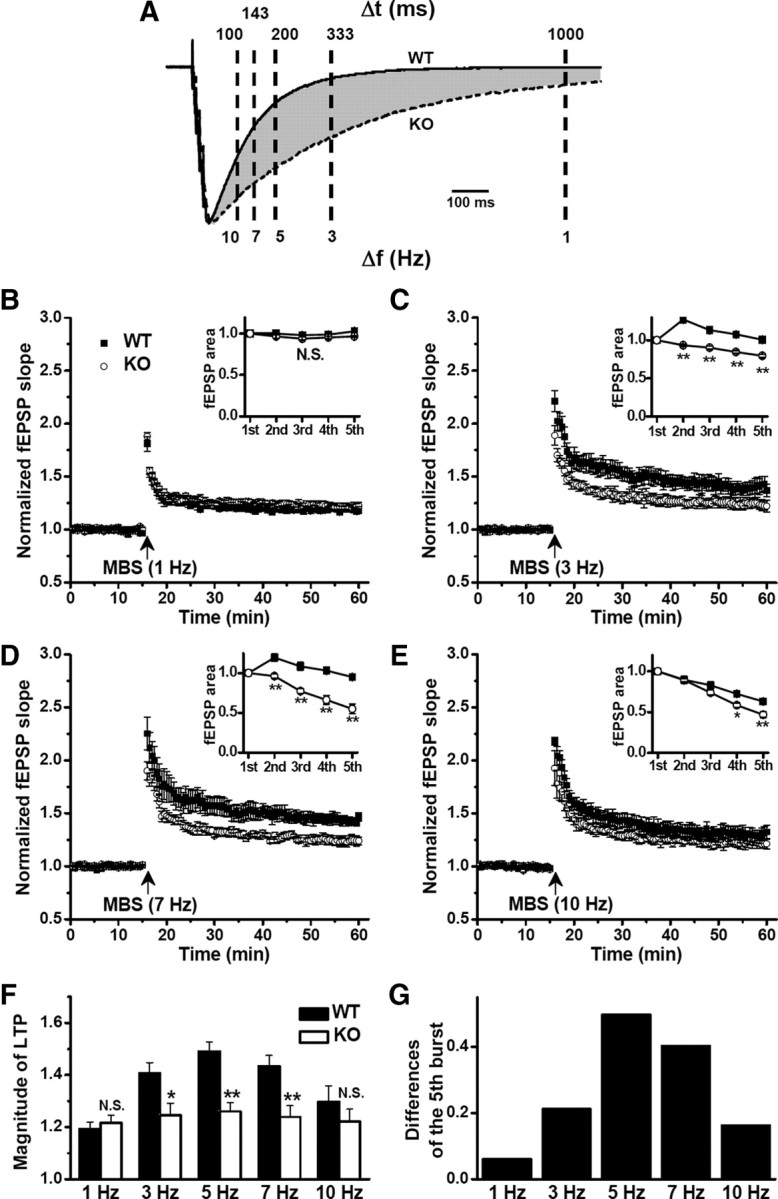
LTP impairment by GAT1 deletion depended on frequency of burst stimulation. A, Superimposed compound IPSCs recorded in slices from WT and GAT1 KO mice. Note the differences (shaded area) at the time points indicated. B–E, LTP induced by MBS given at different interburst intervals (1000 ms/1 Hz, 333 ms/3 Hz, 143 ms/7 Hz, 100 ms/10 Hz) in slices from WT and GAT1 KO mice. Note that LTP induced by 3–7 Hz burst stimulation was significantly impaired in GAT1 KO mice. Inset, comparison of the burst-fEPSP area between WT and GAT1 KO groups (n = 6 for each group). *p < 0.05; **p < 0.01; Student's t test. F, Summary data from B–E. Note the bell-shaped frequency–response relationship for WT mice with greatest LTP induced at 5 Hz (TBS). *p < 0.05; **p < 0.01; N.S., no significant difference, compared with WT group; Student's t test. G, The differences of the fifth burst–fEPSP areas between WT and GAT1 KO groups.