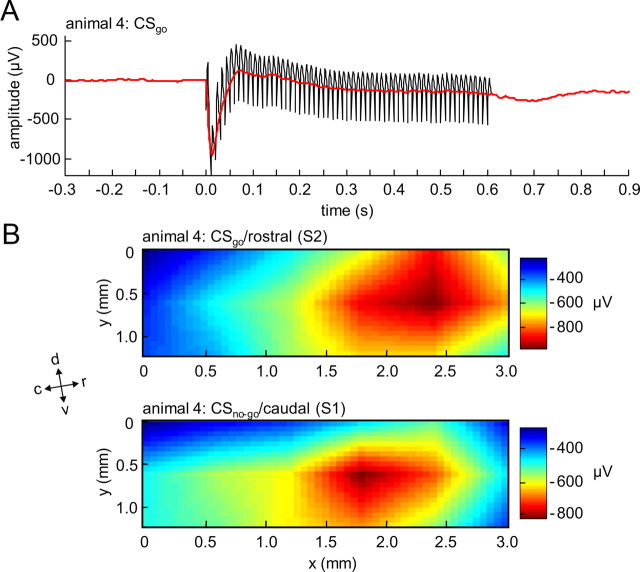
Figure 4.
Time course and spatial distribution of early ICMS-evoked activation. A, Typical example of an EEP from a single animal averaged across CSgo trials in a single session of training. The EEP is shown before (black) and after (red) removal of single pulse stimulus artifacts in the ECoG-recording (see Materials and Methods). A first, prominent negative peak in the EEP can be seen at a latency of ∼20 ms (N20, red arrow). B, Typical example of spatial distributions of the N20 amplitude in response to a CSgo at the rostral stimulation electrode (top) and to a CSno-go at the caudal stimulation electrode (bottom). Anatomical directions relative to the recording array are indicated by arrows (d, dorsal; c, caudal; l, lateral; m, medial; r, rostral; v, ventral).

