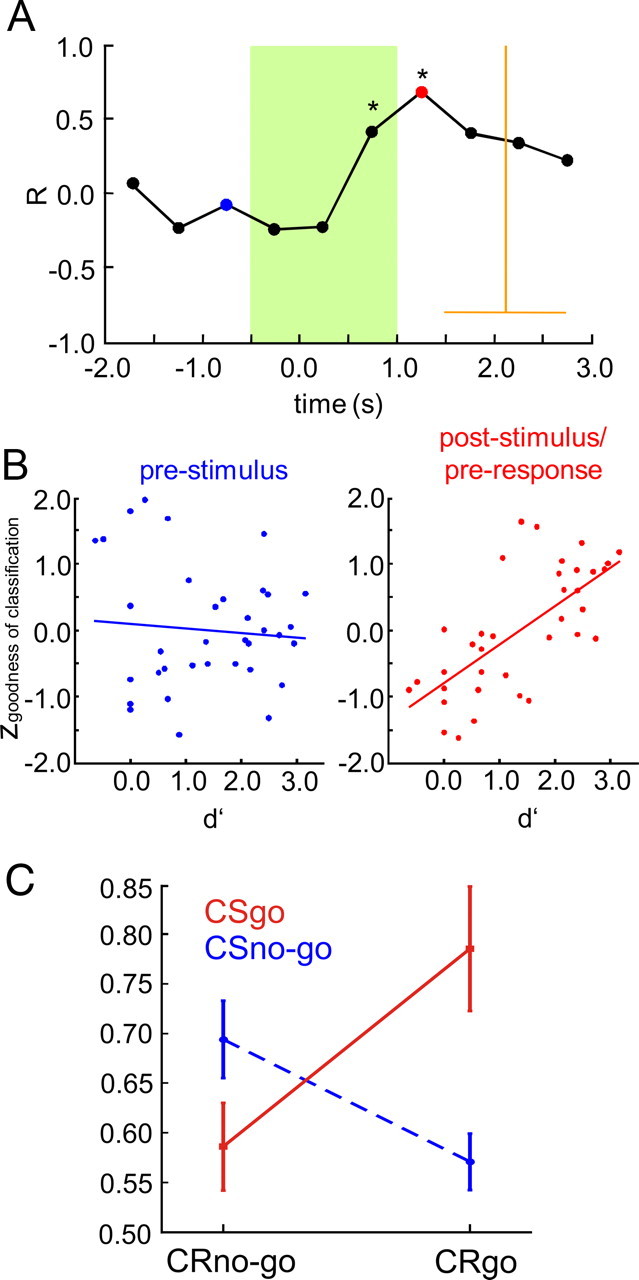
Figure 7.

Late spatial patterns in the ongoing ECoG and their relation to discrimination learning. A, Correlation between behavioral d′ and goodness of classification over sessions is plotted as a function of time relative to stimulus onset. Common correlation coefficients across animals were calculated over sessions between d′ values and maximum goodness of classification values selected from consecutive 500 ms time windows relative to stimulus onset in each session (z-standardized across sessions for each time window). Highly significant correlation (p < 0.01) is marked by asterisks. Statistical testing showed that homogeneity of correlation coefficients across animals held for all time windows (see Materials and Methods). Grand mean and SD of hit reaction times in the last session (pooled across animal) are displayed by vertical and horizontal orange lines, respectively. The time range affected by the electrical stimulus is marked by the green area. B, Detailed plots of the correlation for a prestimulus interval (−1.5 to −0.5 s, blue) and for the poststimulus/preresponse interval (1.0–1.5 s, red). C, Interaction plot showing the effects of factors CR (CRgo and CRno-go), and CS (CSgo and CSno-go) on correct pattern classification. Percentage correct classification was calculated separately for subsets of hit (CRgo,CSgo), miss (CRno-go,CSgo), false-alarm (CRgo,CSno-go), and correct-rejection (CRno-go,CSno-go) trials, at the latency of the maximum goodness of classification in the poststimulus/preresponse interval of the sessions containing the trials (behavioral response time was quantified by the mean hit reaction time in the session). Subsets consisted of the last n hit, miss, false-alarm, and correct-rejection trials collected across sessions 3–7 in each animal, respectively. To avoid biases due to different set sizes, n was matched to the size of the smallest set in each animal (n = 18 ± 9, mean ± SD), which always was the false-alarm set. Percentage correct values are plotted as a function of the factor CR, separately for the CSgo (red line) and the CSno-go (blue dashed line). Higher percentage correct values were found for hit (mean ± SE, 0.79 ± 6%) and correct-rejection (69 ± 4%) trials compared with false-alarm (57 ± 3%) and miss (59 ± 3%) trials. A two-way ANOVA (Huynh-Feldt corrected) with factors CR (CRgo and CRno-go) and CS (CSgo and CSno-go) was then applied to the percentage correct values across animals based on these trial subsets. A significant interaction was found between the factors CR and CS (F(1,5) = 7.417, p < 0.05), but no significant main effects, either for the factor CR (F(1,5) = 1.553, p ≥ 0.05) or the factor CS (F(1,5) = 2.259, p ≥ 0.05).
