
Figure 4.
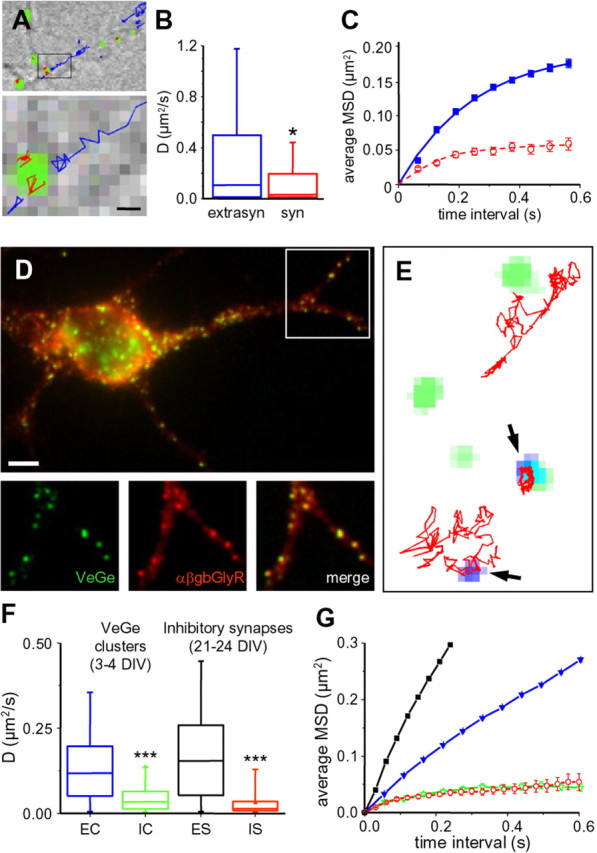
Influence of QD size and presynaptic terminals on ChTx diffusion. A, Single-molecule fluorescence microscopy of Cy5–ChTx. Top, DIC image of neurites showing in green the labeling of rhodamine 123 used to stain synapses. The trajectories of all the single molecules detected in this field over a 100 s recording period are overlaid in blue [extrasynaptic (extrasyn)] or in red [synaptic (syn)]. Bottom, A higher magnification of the region indicated by the rectangle in the top image. Scale bar, 0.5 μm. B, Distribution of D [median and 25–75% interquartile range (IQR); whiskers, 5 and 95% confidence intervals] for Cy5–ChTx in extrasynaptic (blue; n = 1317 trajectories) and synaptic (red; n = 51) membranes (*p < 0.05, KS test). C, Averaged MSD plot (mean ± SEM) of the same trajectories analyzed in B. Same color coding as in B. n = 5 independent experiments using cells from three different cultures. D, Hippocampal neurons at 3 DIV cotransfected with Venus-tagged gephyrin (Ve::Ge; green) and a modified α subunit of glycine receptor (α1βgb–myc; red). Top, Overlay of Ve::Ge fluorescence (green) and α1βgb–myc immunoreactivity (red). Below, Higher magnification of the indicated region in the top image, emphasizing Ve::Ge and α1βgb–myc colocalization. From left to right, Ve::Ge (green), α1βgb–myc (red), and colocalization (yellow). E, Examples of trajectories (red) of QD–ChTx (blue, arrowheads) colocalizing or not with Ve::Ge clusters (green). Scale bar: (in D, top) D, top, 3.8 μm; D, bottom, 5 μm; E, 800 nm. F, Distribution of D (median and 25–75% IQR; whiskers, 5 and 95% confidence intervals) for QD–ChTx over 3–4 DIV neurons compared with 21–24 DIV neurons transfected as in Figure 3 A. EC, Trajectories outside Ve::Ge clusters (blue; n = 6388); IC, trajectories over Ve::Ge clusters (green; n = 68); ES, IS, trajectories over extrasynaptic (black; n = 2025) or inhibitory (red; n = 31) postsynaptic membranes, respectively. n = 4 independent experiments using cells from two different cultures. G, Averaged MSD plot (mean ± SEM) of the same trajectories analyzed in F. Same color coding as in F.