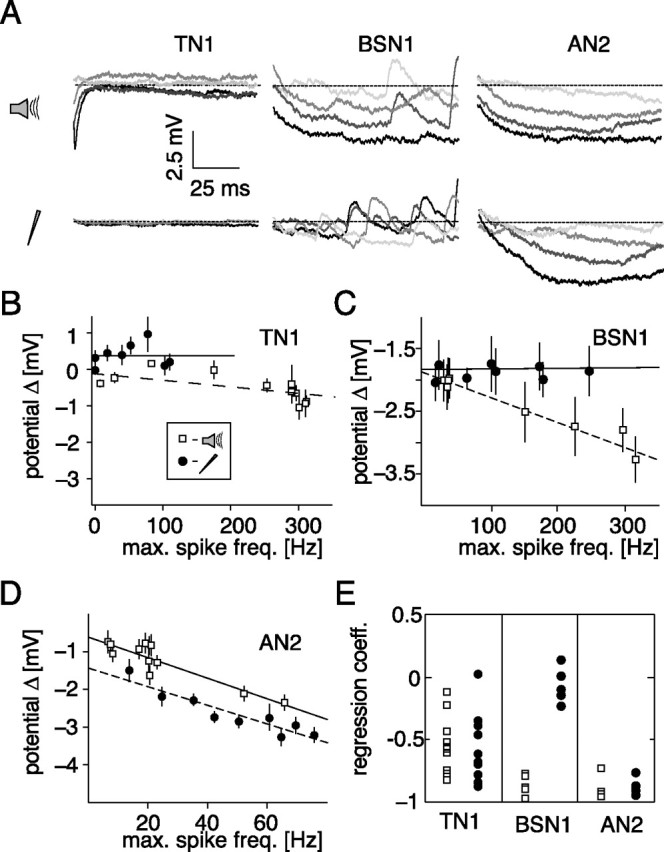
Figure 4.

Hyperpolarization after stimulus offset. A, Time course of the membrane potential for the first 100 ms after stimulus offset for different stimulus intensities. The dotted line depicts the mean potential before stimulus presentation. Darker shading represents a higher intensity of the stimulus. TN1: current, 0.5, 1.0, 1.5, and 2.5 nA; acoustic, 60, 66, 72, and 78 dB. BSN1: current, 0.55, 0.95, 1.5, and 2.25 nA; acoustic, 40, 47.5, 55, and 65 dB. AN2: current, 0.5, 0.6, 0.7, and 0.8 nA; acoustic 45, 55, 65, and 75 dB. B–D, Hyperpolarization after stimulus offset as a function of the maximal spike frequency response during stimulation. Each data point depicts the mean and SD of the minimum of the membrane potential for 10 repetitions in a window 200 ms after stimulation relative to the mean potential before stimulus onset. Open symbols, Acoustic stimulation; filled symbols, current stimulation. Lines show linear fits to the data. B–D, Data from the same cells as in Fig. 5A–C). E, Regression coefficients for linear fits to rate hyperpolarization versus maximal spike frequency for all recorded cells for current and acoustic stimulation.
