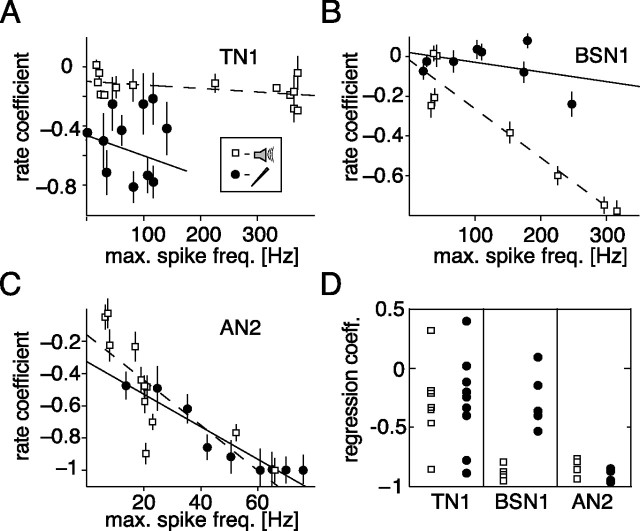
Figure 5.
Spontaneous activity after stimulus offset as a function of the maximal spike frequency response during stimulation. Activity is expressed as the difference in the number of spikes in a window of 200 ms (300 ms for TN1, see Materials and Methods) before and after stimulation relative to the sum of spike numbers in both windows (= rate coefficient). Each data point depicts the mean and SE mean of 10 repetitions. Open squares, Acoustic stimulation; filled circles, current stimulation. Lines show linear fits to the data. A–C, Exemplary data from single cells. A, TN1; B, BSN1; C, AN2. D, Regression coefficients for linear fits to the rate coefficient versus the maximal spike frequency for all recorded cells for current and acoustic stimulation.

