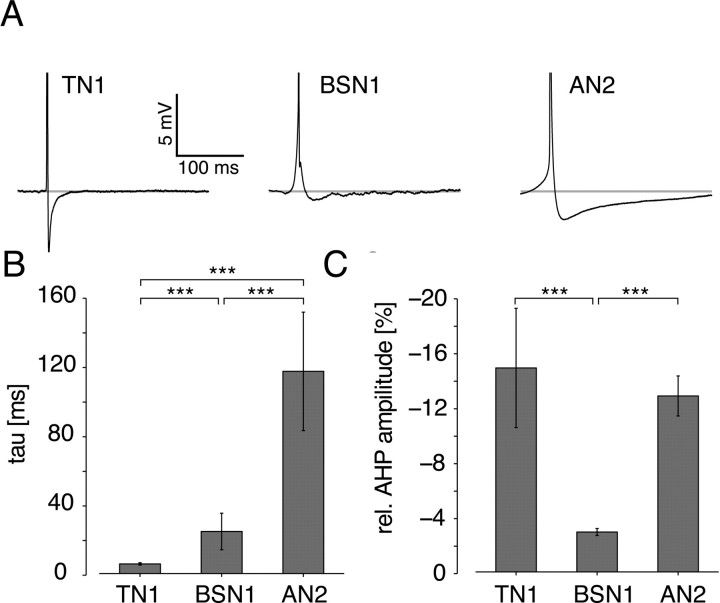
Figure 6.
Spike shapes of the different cell types. A, Median spike form from three exemplary cells; spikes are truncated to display afterhyperpolarization. B, Mean and SD of the time constants of decay of afterhyperpolarization for all tested cells. C, Mean and SD of the minimum of afterhyperpolarization, relative to peak spike amplitude. Asterisks mark significance at the 0.1% level.

