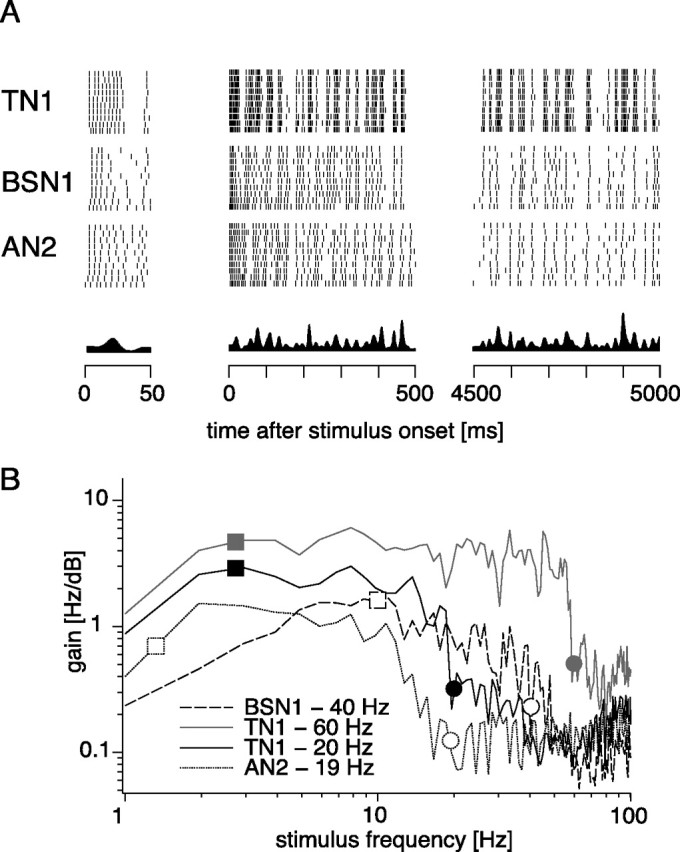
Figure 7.

Coding properties of TN1, BSN1, and AN2 under acoustic stimulation. A, Spike responses of TN1, BSN1, and AN2 under acoustic stimulation by randomly amplitude modulated stimuli. The first 50 ms, first 500 ms, and last 500 ms of a 5 s RAM stimulus are shown. The stimuli had a SD of 6 dB and were filled with a constant carrier at the best frequency of the respective cell. The intensity was chosen to elicit an onset spike frequency response of ∼250 Hz in each of the three cells. At the bottom the envelope of the stimulus is shown. B, Gain functions for a TN1 neuron at two different intensity levels, for a BSN1 and an AN2. In the legend, the mean spike frequency responses in a 4500 ms time window starting 500 ms after stimulus onset are noted. Squares mark the high-pass cutoff for the cells as predicted by their adaptation time constant. Circles mark the mean spike frequency, which predicts the low-pass cutoff.
