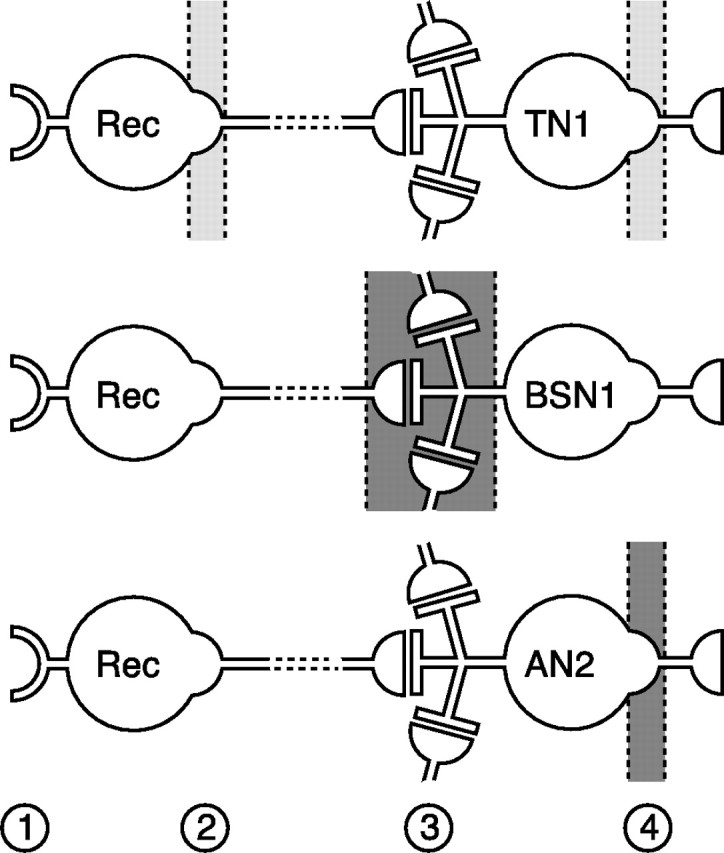
Figure 8.

Distribution pattern of adaptation mechanisms within the auditory pathway. Schematic drawing of the dominating source and location of adaptation for the three cell types under study. The connection between interneurons and receptors cells can be monosynaptic but also indirect, indicated by the broken lines at their connection. The light gray areas in the sketch for TN1 represent balanced influence of two sources; dark gray areas depict one main source of adaptation. Numbers indicate mechanisms of adaptation discussed here: transducer adaptation (1), encoder adaptation in receptor neurons (2), synaptic effects (3), and encoder adaptation in the interneuron (4).
