Figure 1.
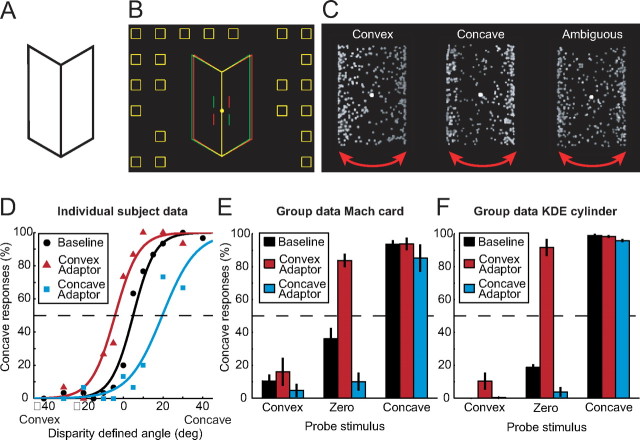
Stimuli and behavioral data. A, A bistable Mach card stimulus. B, A disparity-defined Mach card. When viewed through red-green glasses (left eye red) the stimulus appears concave. The vertical lines flanking the fixation marker were provided to assist correct eye vergence. C, Illustrations of the KDE stimulus. The stimulus rotated around its vertical axis to depict the exterior or interior surface of a cylinder. Texture and shading cues disambiguated the stimulus (left, center), while the ambiguous stimulus was a shuffled version of the convex and concave stimuli. The arrows depict rotation in depth. D, An example psychometric curve showing the proportion of trials on which the observer interpreted the probe Mach card stimulus as concave. Data are shown for the concave adaptor (blue squares), the convex adaptor (red triangles), and in the absence of an adaptor (baseline: black circles). E, F, Group behavioral data (means with error bars depicting bootstrapped 68% confidence intervals) for the Mach card (E) and the KDE stimuli (F). Results are shown for three different types of probe stimuli (convex, zero, concave) following different types of adaptation (convex, baseline, concave).

