
Figure 4.
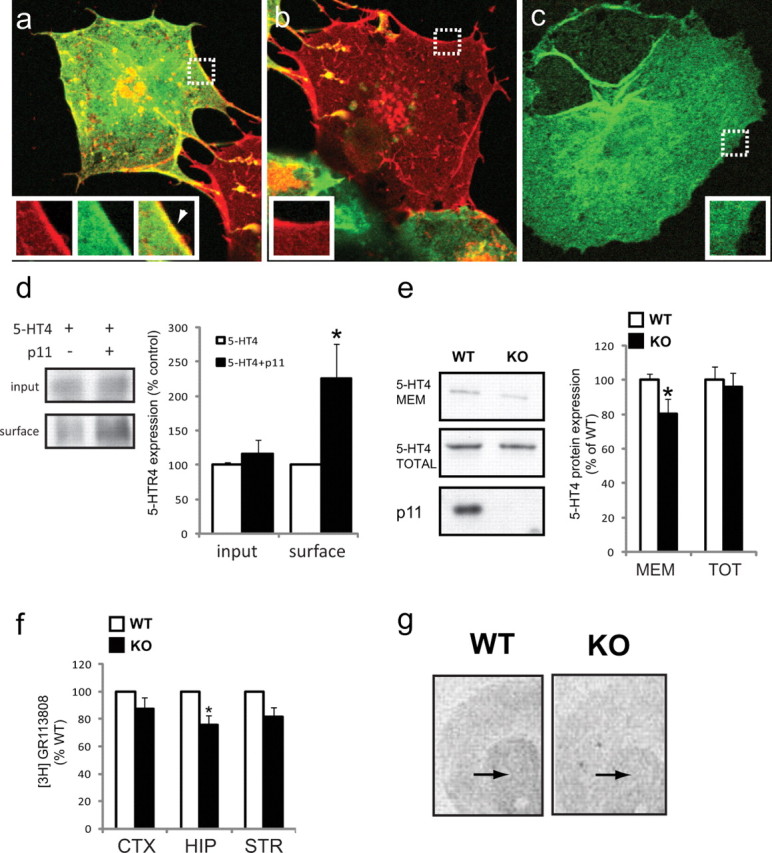
p11 increases 5-HTR4 expression at the plasma membrane. a–c, COS7 cells were transfected with (a) p11 (green) and 5-HTR4 (red), (b) 5-HTR4 alone or (c) p11 alone. Regions included in the inset are marked by white dotted boxes. White arrow head in a indicates colocalization of p11 and 5-HTR4 at cell surface. d, Biotinylation experiment from transfected COS7 cells. Data were normalized to the amount of 5-HTR4 present in cells transfected with only 5-HTR4 (left, Western blot; right, quantification). e, 5-HTR4 protein expression in plasma membrane enriched fraction versus total hippocampal lysate from p11 WT or KO mice (left, Western blot; right, quantification). f, In vitro 5-HTR4 ligand binding assay using [3H]GR113808 in cortex, hippocampus, and striatum of p11 KO or WT mice. g, Representative image for 5-HTR4 ligand binding in striatum (arrows) of p11 WT or KO mice (for quantification, see Results). All data are presented as mean ± SEM, *p < 0.05.