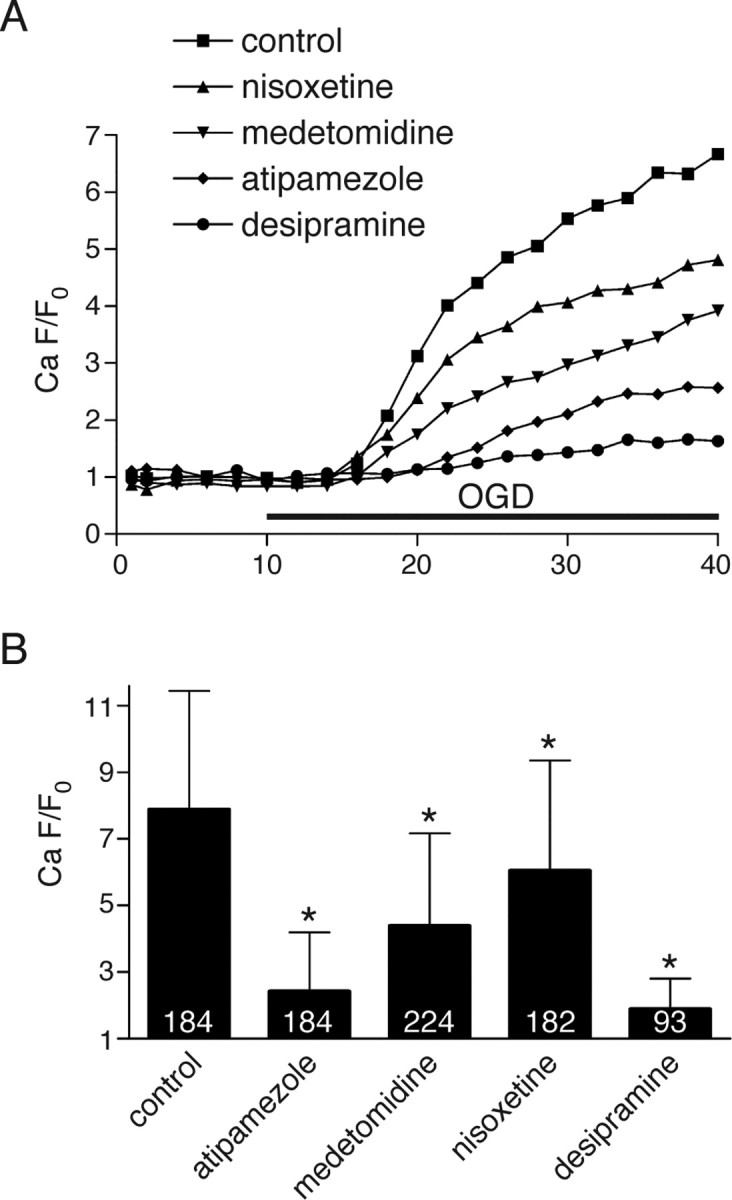
Figure 5.

A, Time course of normalized axonal green (Ca2+-dependent)/red (Ca2+-independent) fluorescence ratio during ischemia showing ≈7-fold Ca2+-sensitive fluorescence increase over baseline after 30 min of OGD. Modulators of α2 receptors or of NE release significantly reduced OGD-induced axonal Ca2+ rise. B, Quantitative summary of Ca2+ responses in individual axons after 30 min of OGD. Numbers within the bars represent the number of individual axons analyzed for each treatment. Error bars indicate SD. *p < 10−8 versus control.
