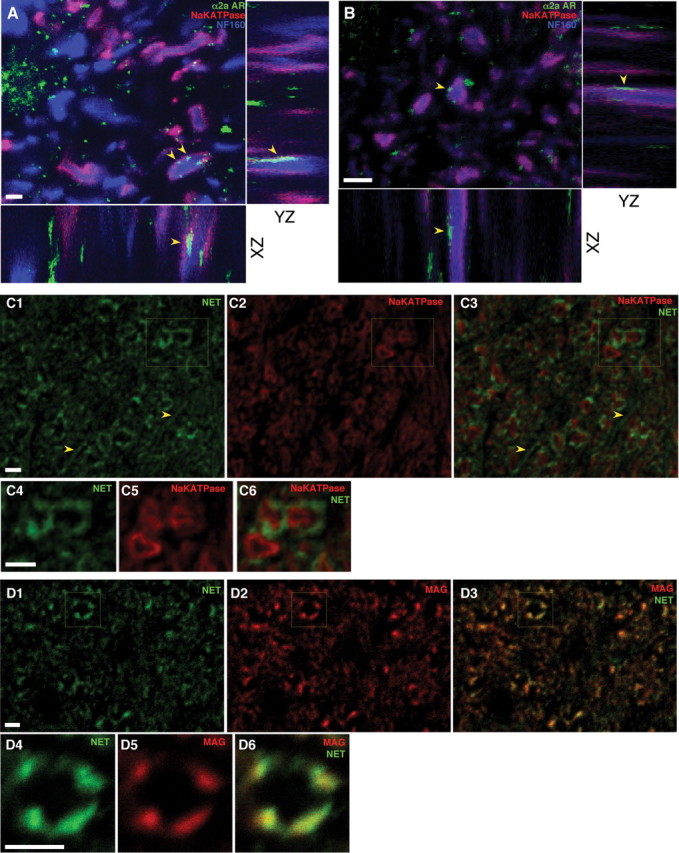
Figure 8.

Dorsal columns (A) and optic nerve (B) sections, triple labeled with α2a adrenergic receptor (green), α3 subunit of the Na+/K+ ATPase (red) and neurofilament 160 (blue) antibodies, with XZ and YZ projection views of a confocal Z series acquired at 0.1 μm steps. Together with the Na+ and Ca2+ imaging (Figs. 5, 6), punctate α2a labeling overlapping Na+/K+ ATPase-decorated axolemma (arrowheads) provides evidence for functional axonally targeted receptors. C, Transverse sections of optic nerve labeled with NET (green) and the axolemmal marker as in A and B. C4–6, Higher-power view of the boxed area in C1–3. D, Transverse optic nerve sections stained with NET (green) and myelin-associated glycoprotein (MAG; red), which identifies the inner surface of the myelin sheath. D4–6, Higher-power view of the boxed area in D1–3. NET is mainly expressed outside the axolemma, strongly colocalizing with inner myelin loops, indicating significant localization to the sheath. Linear profiles (arrowheads in C1, 3) likely represent additional NET expression on glial processes. Controls with primary antibody omitted revealed little detectable signal (data not shown). Scale bars, 2 μm.
