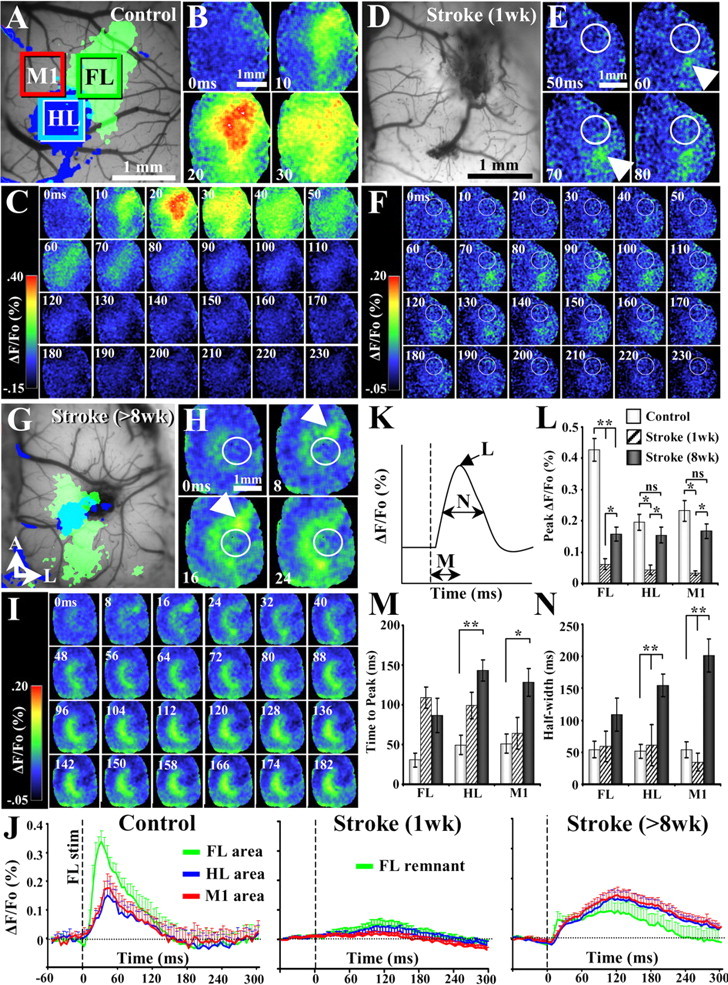
Figure 3.

VSD imaging reveals progressive changes in the spatiotemporal dynamics of forelimb-evoked cortical responses after stroke. A, D, G, Before VSD imaging, IOS imaging was used to visualize the functional representation of the forelimb and hindlimb in controls (A) and after 1 week (D) and 8 weeks (G) recovery from stroke. However, because of the fact that forelimb-evoked IOS signals at 1 week recovery were exceedingly difficult to obtain, only the surface of the brain is shown at this time point. B, C, VSD imaging of cortical responses to forelimb stimulation (one 5 ms tap per trial) in a control mouse. The earliest VSD response originates in the center of the forelimb and quickly spreads to adjacent cortical areas. Note the close correspondence between IOS (A) and VSD-derived maps of the forelimb. E, F, At 1 week recovery, the cortex was mostly unresponsive to forelimb stimulation except in the surviving portion of forelimb cortex posterior to the infarct (infarct denoted by white circle). H, I, After at least 8 weeks recovery from stroke, the earliest VSD signal arises from the remaining piece of the forelimb cortex (indicated by white arrow in H), which then spreads horizontally to motor and hindlimb cortical areas, which are medial and posterior to the infarct (infarct denoted by white circle). Note that, after stroke, motor and hindlimb areas show very prolonged responses to forelimb stimulation. J, Plots summarizing average forelimb, hindlimb, and motor cortical responses (plots derived from green, blue, and red boxes shown in A) to stimulation of the forelimb in controls and stroke-recovered mice at 1 and 8 weeks. Note that, in controls (n = 9 mice), responses in all three areas were relatively brief, peaking within the first 50 ms and rapidly decayed. One week after stroke (n = 6 mice), cortical responses were barely detectable. However, after 8 weeks recovery (n = 6 mice), the amplitude of motor and hindlimb area responses returned to near control levels. Furthermore, peri-infarct motor and hindlimb responses to forelimb stimulation persisted for considerably longer periods of time relative to controls. K–N, Quantification of VSD signal response amplitude (L), time-to-peak (M), and duration (N; time spent at half-maximal response amplitude) in controls and stroke-recovered mice at 1 and 8 weeks. *p < 0.01, **p < 0.001.
