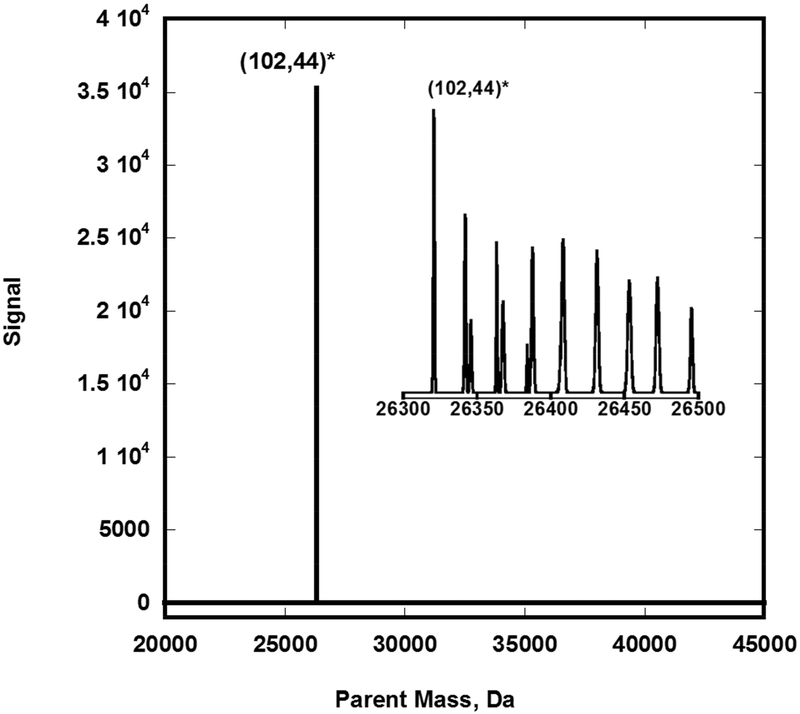
Figure 2: shows how the complex ESIMS spectrogram of the Au102 fraction can be simplified into a single peak using Protein Deconvolution 4.0 software.
The raw negative ion complex spectra of a 50:50 methanol/water solution of the (102,44) fraction was analyzed using Manual Xtract (isotopically resolved) at 4 ppm mass tolerance, 99% confidence, 2–100kDa outpout mass range, and intact protein peak model mode. Four charge states where detected (z = 6- to 9-). The mass tolerance was relaxed to 20ppm to detect the sodium adducts depicted in the inset. Infusion rate = 5 μL/min; particle concentration ~ 0.5 μg/μL; scan duration = 1.0 minute.

