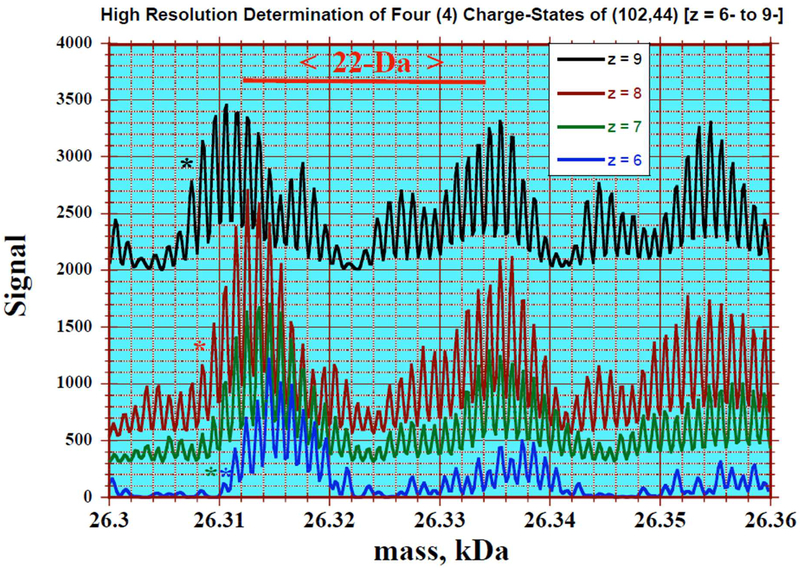
Figure 4: showing the (101, 42) fragmentation product and its sodium adduct at isotopic resolution.
Depicted is an overlay of parent masses calculated by multiplying the raw m/z signal by the indicated charge (folding). The single-Da peak spacing correspond to isotopic patterns while the larger (22 Da) spacing results from multiple Na+ for H+ substitutions in the p-MBA ligand. The signal shifts to lower masses upon further ionization by deprotonation. Infusion rate is 5 μL/min; particle concentration ~ 0.5 μg/μL; scan duration = 1minute.

