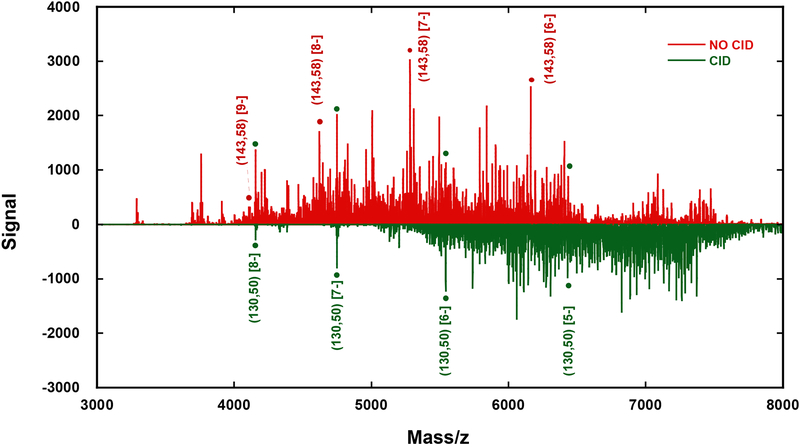
Figure 5: Collisional Dissociation (charge reduction) results demonstrating the resilience of (130,50).
Compared are signals from the aqueous Au144-rich fraction before in source Collisional Induced Dissociation –CID- (positve axis, red trace) and the signal under CID of 20 eV at the source (negative axis, green trace). The signal from (130,50), highlighted with solid green dots, is notable before fragmentation and dominates the low (m/z)-range after CID conditions. Infusion rate is 5 μL/min; particle concentration ~ 0.5 μg/μL; scan duration = 0.5 minutes.

