Figure 1.
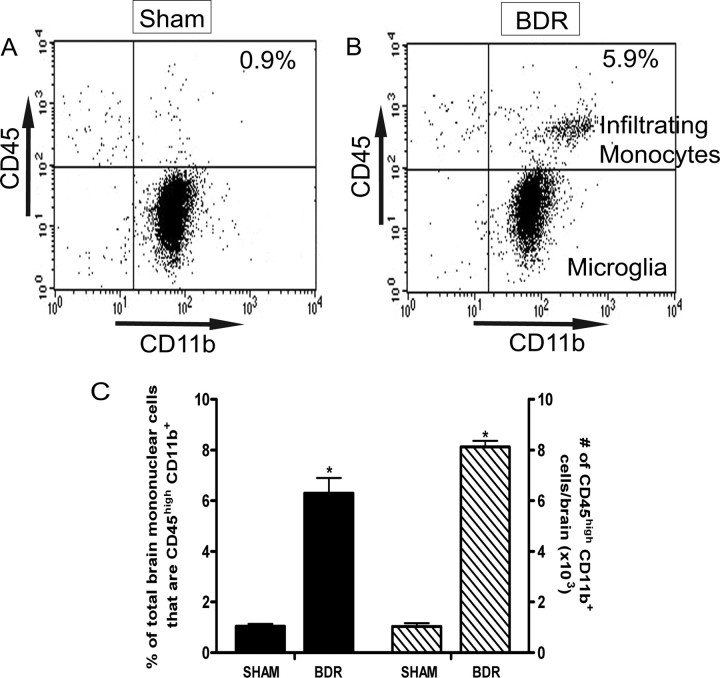
Monocytes infiltrate the brains of BDR mice. A, B, Representative flow cytometry profiles from sham (A) and BDR (B) mouse at day 10 postsurgery. Resident microglia were identified as CD45low CD11b+ cells (bottom right quadrant). Cerebral infiltrating monocytes were identified as CD45high CD11b+ cells (top right quadrant) and were clearly distinguishable from the CD45low CD11b+ cells. The inserted number shows the percentage of total brain mononuclear cells that are CD45high CD11b+. C, Solid bars represent the percentage of total brain mononuclear cells isolated from day 10 sham and BDR mice that are CD45high CD11b+. Hatched bars represent the total number of CD45high CD11b+ cells in the brains of day 10 sham and BDR mice. Error bars represent mean ± SEM of data from 9 sham and 9 BDR mice; *p < 0.05 versus sham controls.

