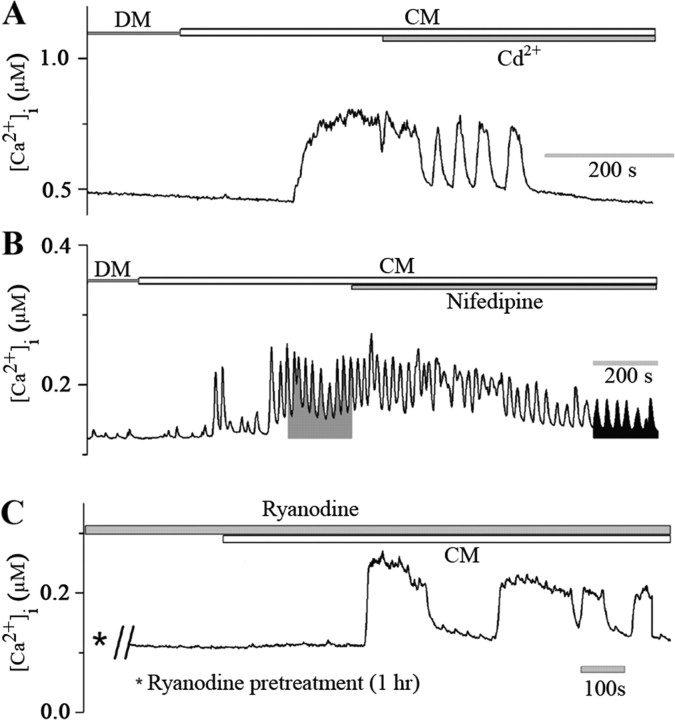
Figure 5.
CM-induced Ca2+ oscillations in LPeD1 cells involve Ca2+ influx via VGCCs. A, LPeD1 cells were cultured overnight in DM and were loaded with Ca2+ indicator dye Fura-2 AM after 12–18 h. Images were acquired first in CM and then CM containing blockers of VGCCs. As reported earlier, CM perfusion significantly increased [Ca2+]i from 181 ± 42 nm to 334 ± 36 nm (n = 8). Cd2+ (100 μm) was then added to the dish containing CM while continuously monitoring [Ca2+]i. Within minutes of adding Cd2+ to the culture, the CM-induced Ca2+ oscillations were almost completely blocked. Similarly, nifedipine (10 μm) significantly reduced both the amplitude and the frequency of CM-induced Ca2+ oscillations in LPeD1 neurons (B). The shaded areas represent the time integral of Ca2+ signal for 200 s induced by CM alone (15 ± 6 μm s) and CM in combination with nifedipine (6 ± 2 μm s) (n = 6). C, To rule out the involvement of Ca2+-induced Ca2+ release from the intracellular stores, cells were pretreated with ryanodine (50 μm, 1 h), and Ca2+ images were acquired first in DM and then in the presence of CM. We found that ryanodine failed to block CM-induced Ca2+ increase in LPeD1 neurons. Thus, CM-induced Ca2+ elevation in LPeD1 cells mainly involves Ca2+ entry via VGCCs, but not Ca2+-induced Ca2+ release from ryanodine-sensitive intracellular Ca2+ store.

