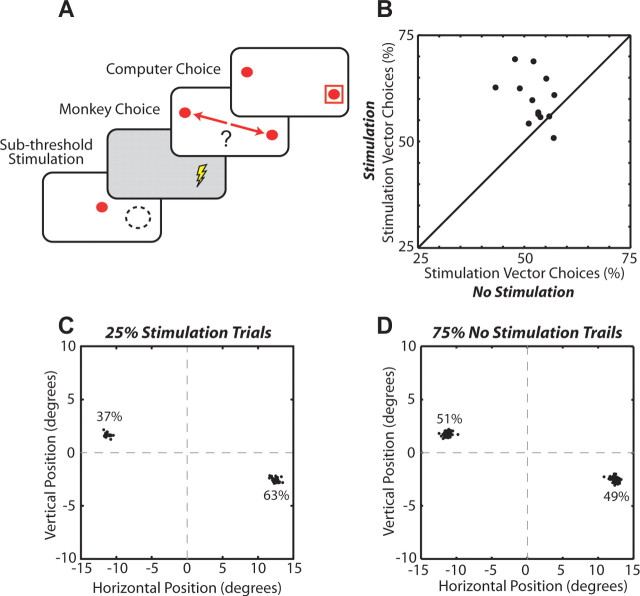
Figure 10.
Manipulating mixed-strategy selections with subthreshold stimulation. A, Behavioral paradigm. Subthreshold stimulation was applied during the first 500 ms of the 600 ms warning period at a SCi location that corresponded to one of the mixed-strategy targets. The dashed circle and associated lightning bolt indicate stimulation vector. B, Percentage of choices allocated toward the stimulation-vector target during stimulation and nonstimulation trials. The diagonal lines represent the line of unity (N = 13 stimulation sites). C, D, Endpoints of saccades during stimulated (C) and nonstimulated (D) trials for a representative stimulation site (∼75 stimulation trials for each stimulation site).

