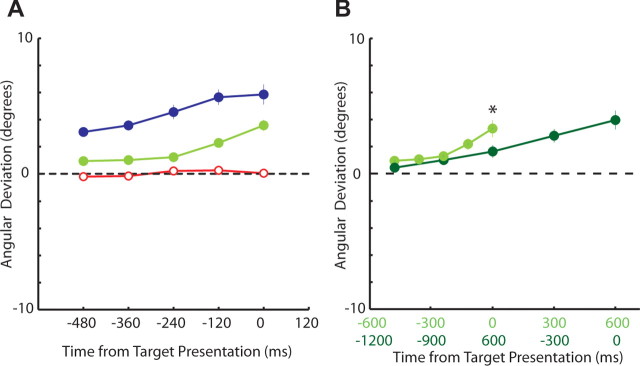
Figure 9.
Evolution of angular deviations over time. A, Angular deviations for mixed-strategy (green), predictable (blue), and unpredictable (red) tasks (N = 11 stimulation sites). B, Comparison of angular deviations when the fixed warning period was extended from 600 ms (green) to 1200 ms (dark green) during two blocks of the mixed-strategy game (N = 10 stimulation sites). The format is the same as that of Figure 4.

