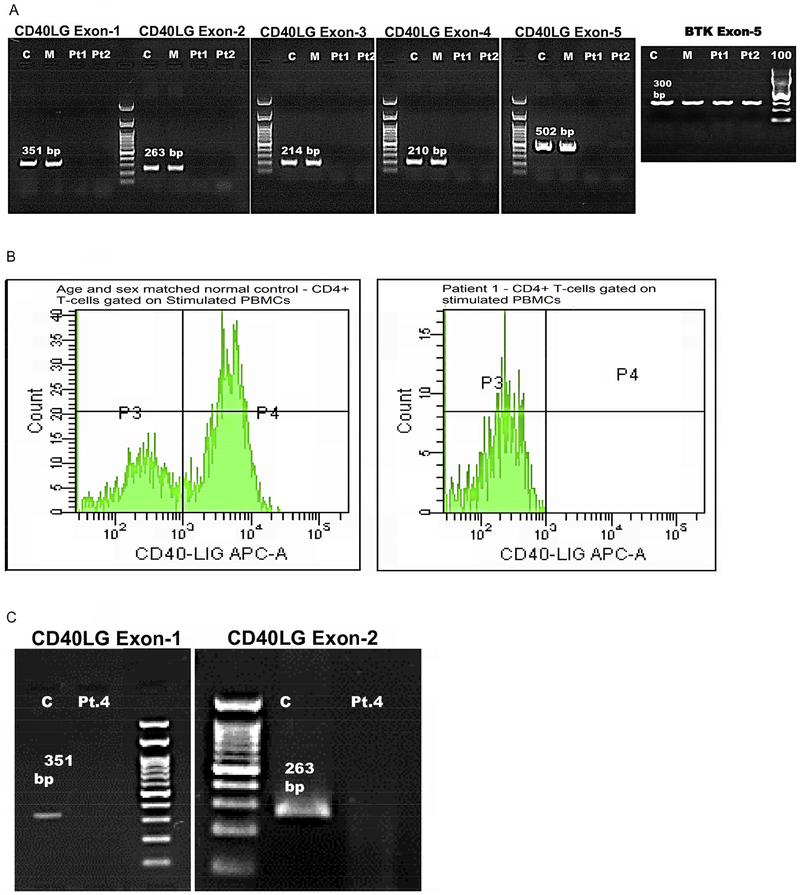
Fig. 1.
(A) Agarose Gel (1.5%) electrophoresis of PCR products from amplification of the five exons of CD40LG gene and BTK Exon-5 (300 bp) of Pt.1, Pt.2, Mother and an age-matched healthy control. Fig. 1(B) CD40L expression by flow cytometry: Histogram depicting CD40L expression on CD4+ activated T cells; Left panel showing normal CD40L expression in control (50.3%); Right panel with no CD40L expression in Pt 1 (0%). Fig. 1(C) Agarose Gel (1.5%) electrophoresis of PCR products from amplification of Exon 1 and Exon 2 CD40LG of Pt.4 and an age matched healthy control. No amplification of exons 1 and 2 in Pt. 4.

