
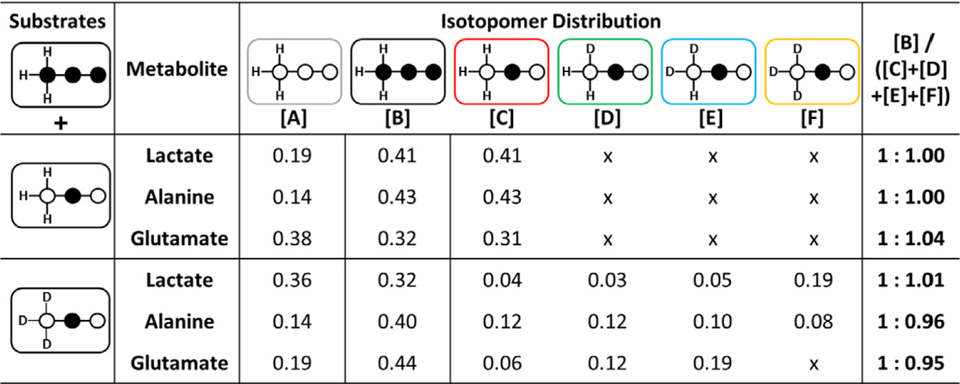
Table 1.
The relative concentrations of species [A] through [F] as reported by 13C and 1H NMR spectra of each metabolite in tissue extracts. The glutamate values were determined by analysis of glutamate C4 and C5 resonances. A full table of all values with error values is provided in ESI Table S3.
|