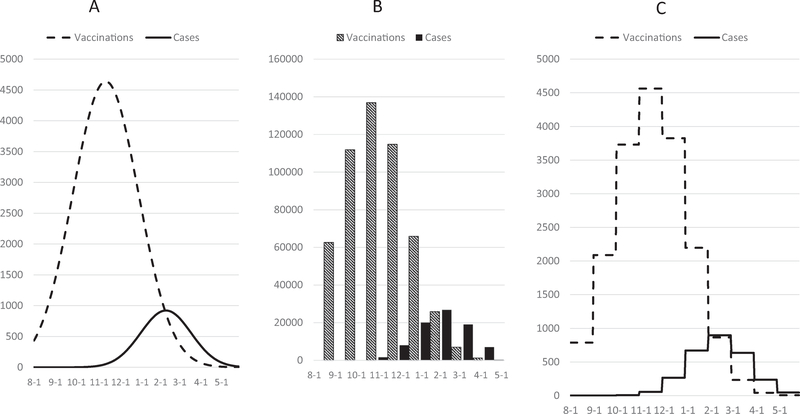
Fig. 2.
Simulated data used to test estimation methods. A, incident daily counts of vaccinations and cases simulated using the normal probability density distribution. B, daily data aggregated into months was used for test methods 1–6. C, monthly aggregated data was divided by number of days per month to create a proxy for daily data, forming a step function, and used for test method 7.

