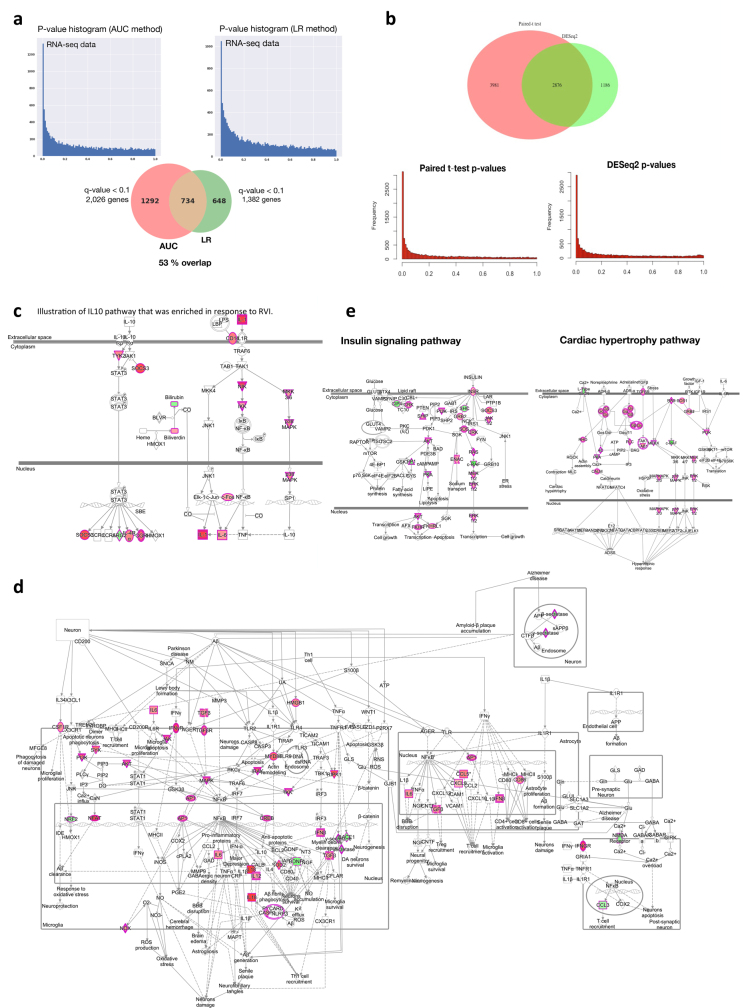
Extended Data Fig. 4. Differential responses to RVIs.
a, Comparison of AUC test (two-sided) performance with LR analysis with the time covariate. Left, distribution plot of P values resulting from the AUC test. Right, distribution plot of P values resulting from the LR analysis. The pie chart shows the number of differentially expressed genes (q < 0.1) for both methods and the overlapping number. b, Top, comparison of results from paired t-test (two-sided) with DESeq2 method (Wald test) for stage pairwise analyses (for example, EE versus personal healthy baseline). Seventy-one per cent of transcripts identified by DESeq2 method overlap with paired t-test results. Bottom, P value distribution for paired t-test (left) and DESeq2 (right). Both methods show a homogenous distribution of P values with enrichment for significant ones. Supplementary Table 39 lists molecules found significant by paired t-test or DESeq2 method. c, Illustration of IL10 pathway enriched in response to RVI. Multi-omic molecules that changed significantly during the course of RVI by AUC test are highlighted in red (upregulated) or green (downregulated). d, An example of enriched neuroinflammation signalling showing molecules significantly upregulated (red) or downregulated (green) in response to RVI. Simplified pathway graph is shown in Fig. 3a (bottom). e, Illustration of insulin signalling (left) and cardiac hypertrophy (right) pathways, which were enriched in response to RVI. Molecules that changed significantly during the course of RVI by AUC test are highlighted in dark pink (upregulated) or green (downregulated).

