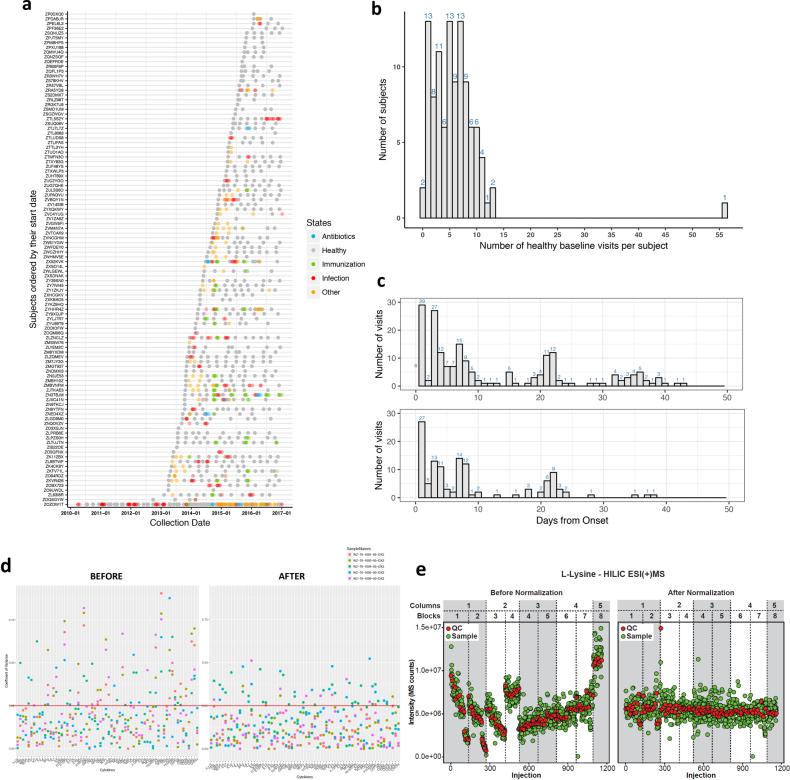
Extended Data Fig. 1. Summary of visits sampled and technical normalization across the study.
a, Visit chart along the time axis illustrated for each subject. b, Number of healthy baselines across the study per subject. c, Number of event visits (top, RVI; bottom, immunization) since the onset of events. Visits with defined days from onset of events were counted. d, Comparison of before and after normalization of cytokine data in order to correct batch effects during the assay. The after-normalization data show overall reduced coefficient of variation (CV). Red line, 25% CV. An example is shown for correcting five samples from two batches. e, Comparison of before (left) and after (right) LOESS normalization of metabolite data using l-lysine as an example. l-Lysine signal drift with time was independently corrected by fitting a LOESS curve to the l-lysine signal measured in QCs. QCs were injected every ten biological samples and consisted of an equimolar mixture of 150 random samples from the study. Red, l-lysine signals from QCs; green, biological samples in HILIC ESI(+) MS mode.

