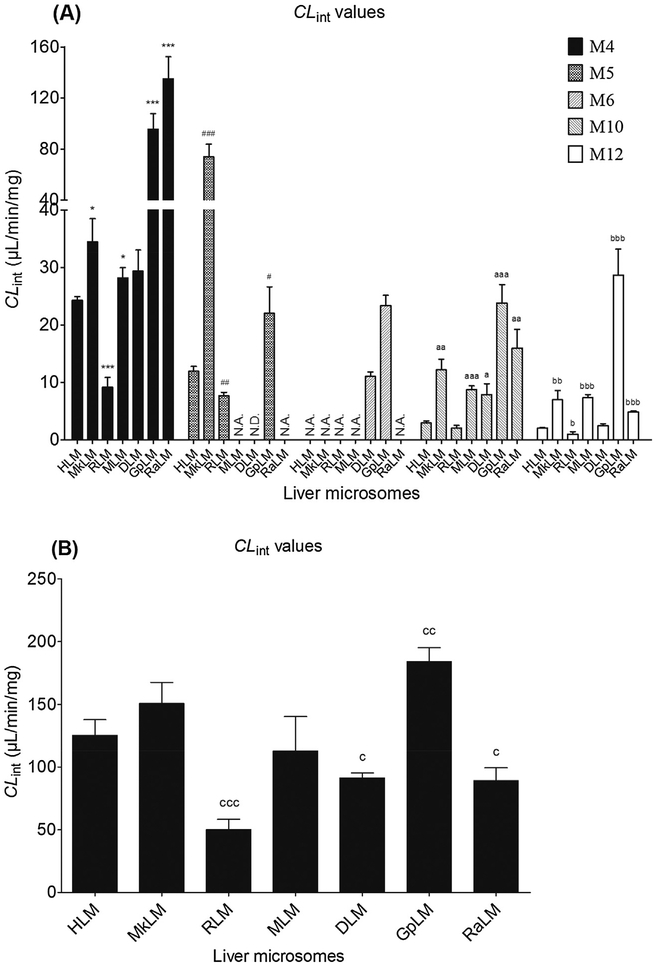
Fig. 3.
Comparison of the CLint values of human liver microsomes and five animal microsomes for phase I metabolism (A) and glucuronidation of corylin (B). (*,#,a,b and c compared with the CLint values of M4, M5, M10, M12 and M7 in HLM, respectively. (*,#,a,b,c p < 0.05, **,##,aa,bb,cc p < 0.01, ***,###,aaa,bbb,ccc p < 0.001).

