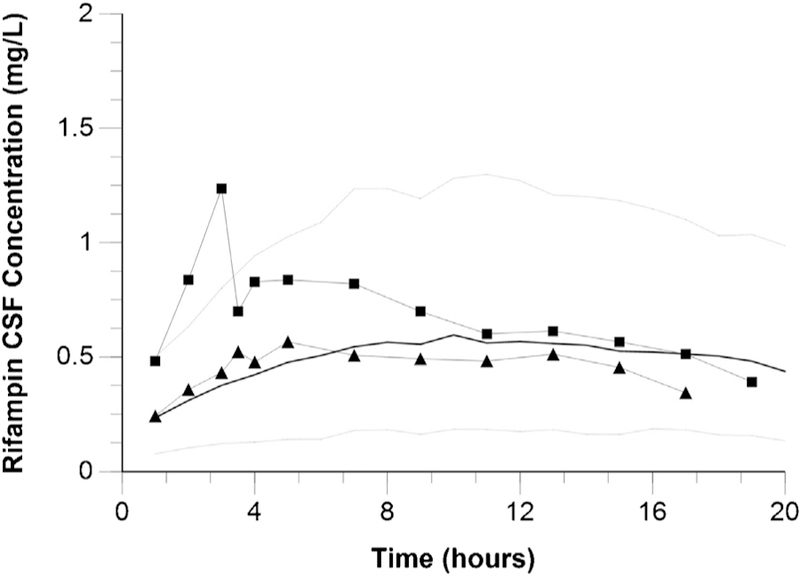
Figure 4.

Model-predicted and observed rifampicin CSF concentrations during 24 h following intravenous administration to seven patients post intraventricular shunt placement (Kaojarern et al., 1991). Squares represent the highest observed rifampicin CSF concentrations among study subjects; triangles represent the lowest observed rifampicin CSF concentrations among study subjects. Black lines represent the median predicted rifampicin CSF concentrations; grey dotted lines represent the 10th and 90th percentiles of predicted rifampicin CSF concentrations.
