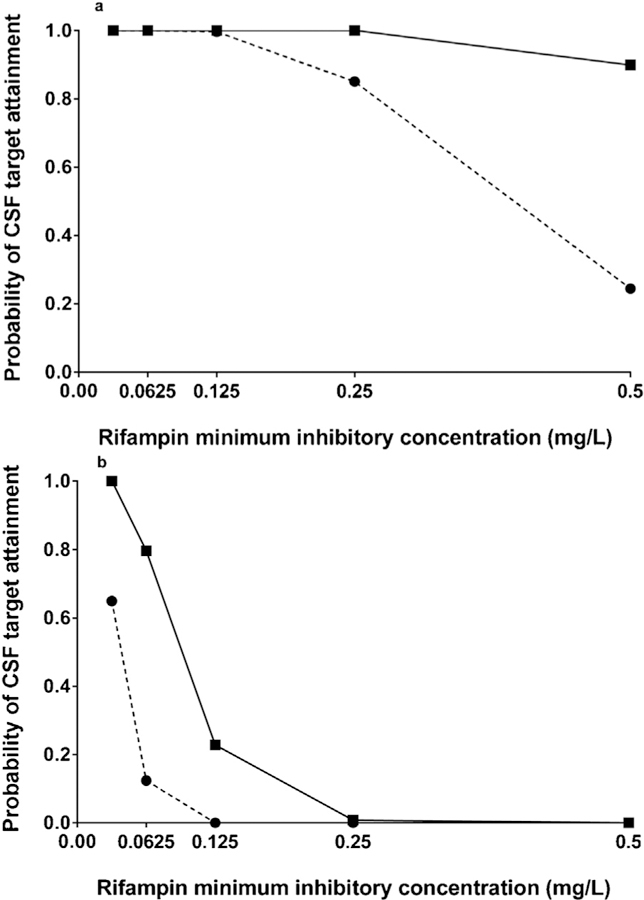
Figure 5.

Monte Carlo simulation of CSF rifampicin target attainment according to rifampicin MIC level, comparing standard (10 mg/kg) and intensified (20 mg/kg) dosing strategies. (a) Rifampicin CSF AUC0–24/MIC ratio of 30, corresponding to a 1-log10 fall in colony-forming units for extracellular Mycobacterium tuberculosis. The dashed line and circles represent the standard weight-based dosing bands, approximating 10 mg/kg. The solid line and squares represent the intensive weight-based dosing bands, approximating 20 mg/kg. (b) Optimal rifampicin CSF AUC0–24/ MIC ratio of 297, corresponding to rifampicin EC50 against extracellular M. tuberculosis. The dashed line and circles represent the standard weight-based dosing bands, approximating 10 mg/kg. The solid line and squares represent the intensive weight-based dosing bands, approximating 20 mg/kg.
