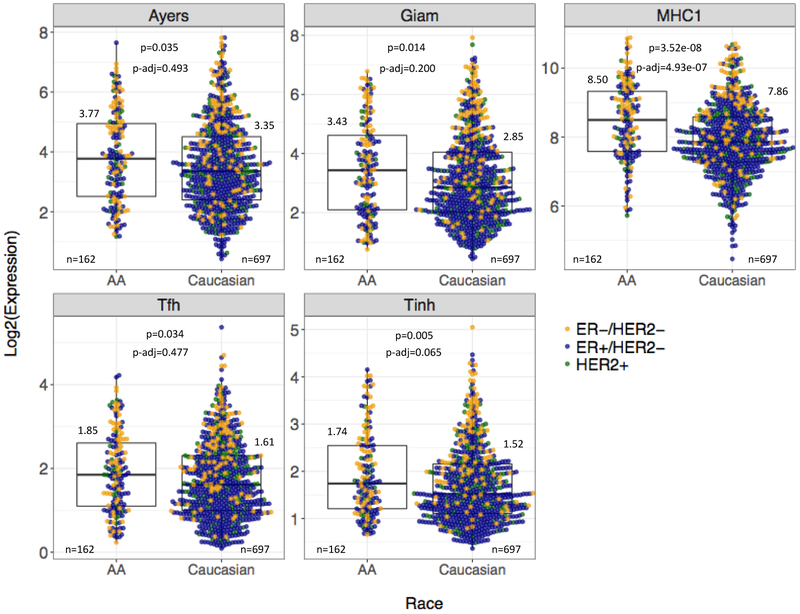
Figure 1. Expression of representative immune metagenes in breast cancer by patient race across all tumor subtypes.
Boxplots summarize the median and IQR expression of five representative immune metagenes by race in the TCGA cohort. All tumor subtypes are included. Log2-transformed median values, available cases (n), Wilcoxon Rank Sum p-values, and Bonferroni adjusted p-values are displayed for each metagene. Colored points represent the log2-transformed, normalized expression of ER-positive, HER2-positive, and TNBC cases for each metagene.

