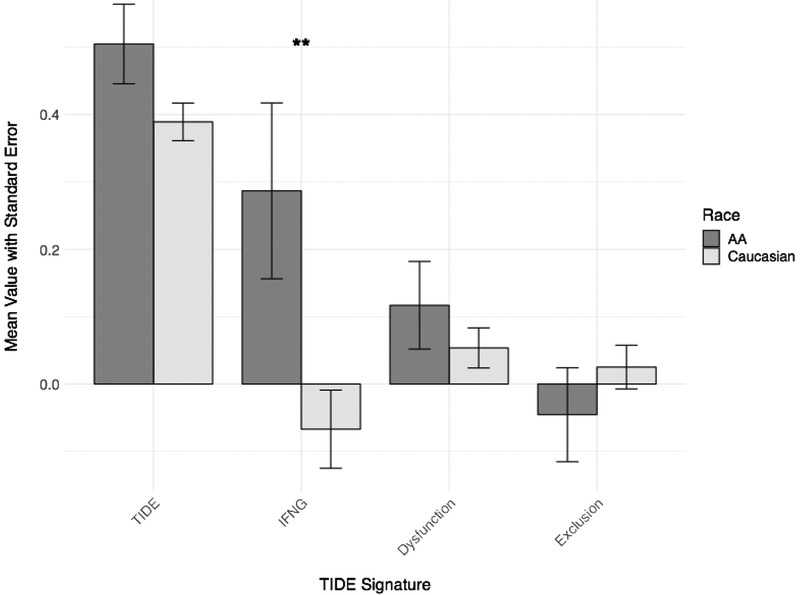
Figure 2. Tumor Immune Dysfunction and Exclusion (TIDE) scores by patient race across all tumor subtypes.
The mean TIDE, IFN-gamma (“IFNG”), T-cell dysfunction (“Dysfunction”), and T-cell exclusion (“Exclusion”) scores are displayed for each race cohort, with error bars representing standard error of the mean. All tumor subtypes are included. The means of AA scores are in dark grey; the means of Caucasian scores are in light grey. **Student’s t-test p=0.014.

