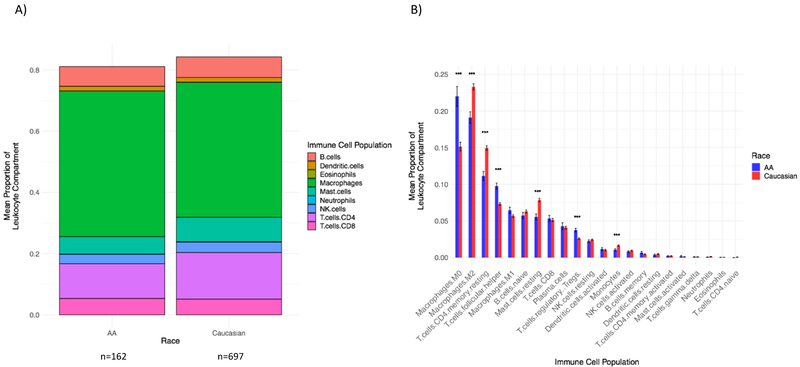
Figure 3. Relative proportions of immune cell populations by patient race across all tumor subtypes.
A) Bars display the mean proportions of 9 aggregated immune cell populations. Race is on the x-axis, and the mean proportion of the leukocyte compartment is on the y-axis. All tumor subtypes are included (n=162 AA, n=697 Caucasian). The height of the bars is < 1.0 due to the fact that the mean proportion of each immune cell population was independently calculated, then aggregated. Colors represent individual immune cell populations.
B) Bars display the mean proportions of 22 immune cell populations. Immune cell population is on the x-axis, and the mean proportion of the leukocyte component, with standard error of the mean, is on the y-axis. All tumor subtypes are included. The mean of AA patients is in blue; the mean of Caucasian patients is in red. All p-values are Bonferroni adjusted. *** = statistical significance by Student’s t-test p<0.005: Macrophages M0 p-adjusted=5.87e-06, Macrophages M2 p-adjusted=3.97e-06, T cells CD4+ memory resting p-adjusted=5.17e-08, T cells follicular helper p-adjusted=1.41e-07, Mast cells resting p-adjusted=1.16e-06, T cells regulatory p-adjusted=1.28e-05, Monocytes p-adjusted=5.44e-04.

