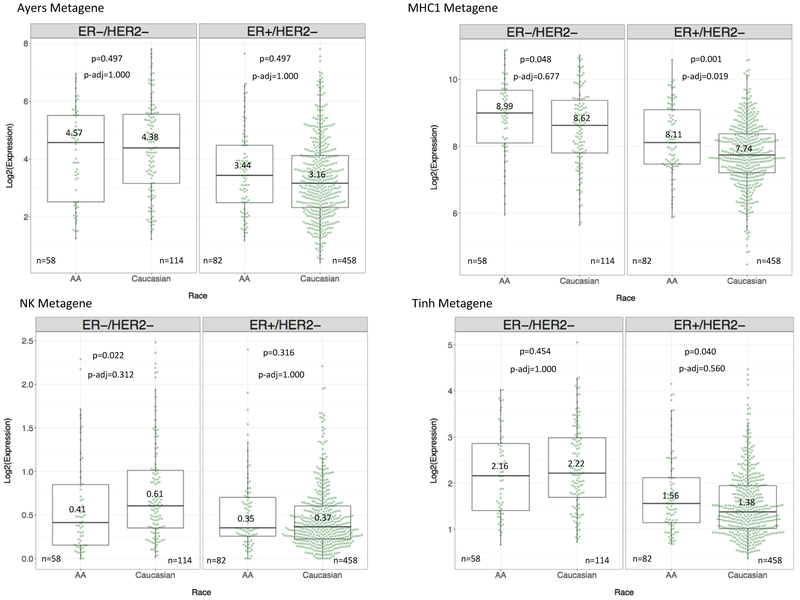
Figure 4. Differential expression of representative immune metagenes by patient race and individual tumor subtype.
Boxplots demonstrate the median and IQR expression of four representative immune metagenes, grouped by tumor subtype and patient race. TNBC cases are in the left panel and ER-positive cases in the right panel. Race is on the x-axis, and log2-transformed, normalized expression of the metagene is on the y-axis. Log2-transformed median values, available cases (n), Wilcoxon Rank Sum p-values, and Bonferroni adjusted p-values are displayed for each metagene.

