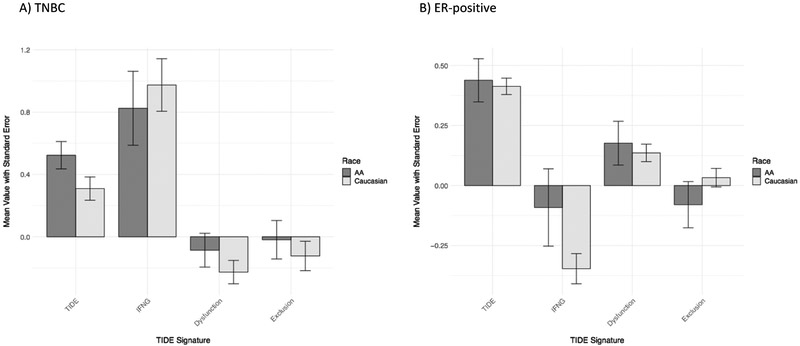
Figure 5. Tumor Immune Dysfunction and Exclusion (TIDE) scores by patient race and tumor subtype.
The mean TIDE, IFN-gamma (“IFNG”), T-cell dysfunction (“Dysfunction”), and T-cell exclusion (“Exclusion”) scores are displayed for each race cohort with error bars representing standard error of the mean. The means of AA scores are in dark grey; the means of Caucasian scores are in light grey. A) Signatures for TNBC cases only, B) Signatures for ER-positive cases only.

