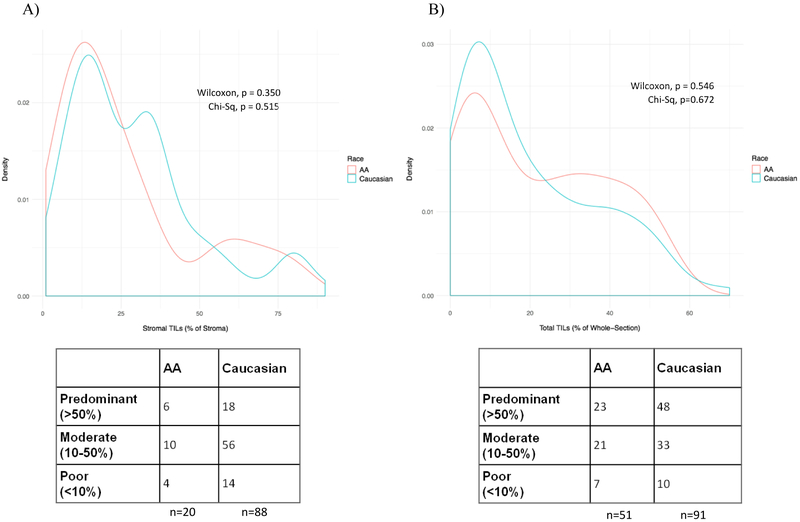
Figure 8. Stromal and total TIL counts by race in TNBC cases alone.
Density plots display the distributions of TIL counts in TNBC cases by race. Red and blue lines represent AA and Caucasian TNBC, respectively. The corresponding table represents the number of lymphocyte-predominant, lymphocyte-moderate, and lymphocyte-poor cases in each cohort, classified as >50% TIL infiltration, 10-50% TIL infiltration, and <10% TIL infiltration, respectively.
A) Stromal TIL counts from Loi et al are displayed as % of tumor stroma. n=20 AA Caucasian and n=88 Caucasian TNBC were considered. Neither the median stromal TIL counts (Wilcoxon p=0.350) nor the distribution of TIL burden classification (Chi-Square p=0.515) was significantly different between races.
B) Whole-section total TIL counts from Lehmann et al are displayed as % of whole section. n=51 AA Caucasian and n=91 Caucasian TNBC were considered. Neither the median stromal TIL counts (Wilcoxon p=0.546) nor the distribution of TIL burden classification (Chi-Square p=0.672) was significantly different between races.

