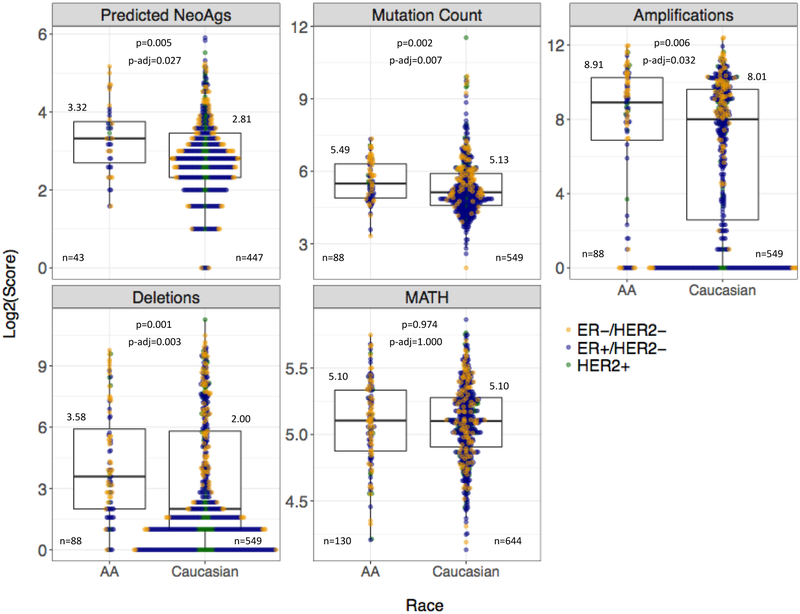
Figure 9. Comparison of genomic aberrations and clonal heterogeneity by race across all tumor subtypes.
Boxplots demonstrate the median and IQR scores of four genomic aberration measures and the MATH clonal heterogeneity score, grouped by race cohort. All tumor subtypes are included. Race is on the x-axis; log2-transformed score of the measure is on the y-axis. Log2-transformed median values, available cases (n), Wilcoxon Rank Sum p-values, and Bonferroni adjusted p-values are displayed for each measure. Colored points represent the log2-transformed scores of ER-positive, HER2-positive, and TNBC cases for each genomic metric. Abbreviations: Predicted NeoAgs = Predicted Neoantigens, MATH = Mutant-Allele Tumor Heterogeneity.

