Abstract
As part of the EXPLORER total-body positron emission tomography (PET) project, we have designed and built a high-resolution, high-sensitivity PET/CT scanner, which is expected to have excellent performance for companion animal whole body and human brain imaging. The PET component has a ring diameter of 52 cm and an axial field of view of 48.3 cm. The detector modules are composed of arrays of lutetium (yttrium) oxyorthosilicate (LYSO) crystals of dimensions 2.76 × 2.76 × 18.1 mm3 coupled to silicon photomultipliers (SiPMs) for read-out. The CT component is a 24 detector row CT scanner with a 50 kW x-ray tube. PET system time-of-flight resolution was measured to be 409 ± 39 ps and average system energy resolution was 11.7% ± 1.5% at 511 keV. The NEMA NU2–2012 system sensitivity was found to be 52–54 kcps MBq−1. Spatial resolution was 2.6 mm at 10 mm from the center of the FOV and 2.0 mm rods were clearly resolved on a mini-Derenzo phantom. Peak noise-equivalent count (NEC) rate, using the NEMA NU 2–2012 phantom, was measured to be 314 kcps at 9.2 kBq cc−1. The CT scanner passed the technical components of the American College of Radiology (ACR) accreditation tests. We have also performed scans of a Hoffman brain phantom and we show images from the first canine patient imaged on this device.
Keywords: total-body PET, PET/CT, companion animal imaging, EXPLORER, brain PET
1. Introduction
Positron Emission Tomography (PET) is a radiotracer-based molecular imaging technique that is used to observe metabolic processes in the living body. Current clinical PET scanners have an axial field of view (AFOV) ranging from ~15 cm to ~30 cm. This results in several limitations. Firstly, most of the emitted radiation is not detected, as most of the patient’s body is outside of the field of view—this, combined with patient dose considerations results in long scan times and poor data quality. Secondly, high-precision kinetic modeling of radiotracer behavior in vivo is limited to single organ studies, again since most of the body is outside of the field of view. These limitations are potentially addressable if the AFOV is extended beyond 30 cm and this concept has been under consideration for some time (e.g. Badawi et al (2000), Watanabe et al (2004), Conti et al (2006), Couceiro et al (2007), Wong et al (2007), Eriksson et al (2008), Yamaya et al (2008a) and Yoshida et al (2013)). In 2006, Cherry suggested that the AFOV of PET scanner should be extended to contain the entire human body (Cherry 2006). In 2011 the EXPLORER (EXtreme Performance LOng REsearch scanneR) Consortium was formed with a view to building the world’s first total body PET scanner, which would provide close to maximal geometric sensitivity and would also enable total-body kinetic studies. Simulations have suggested that such a device would be ~40 times more sensitive than ~22 cm AFOV scanners for total-body applications (Poon et al 2012, Poon 2013). The Consortium also has identified a range of clinical and research applications that would greatly benefit from the total-body PET scanner approach (Berg et al 2018, Cherry et al 2017, 2018).
The EXPLORER Consortium is currently developing a total-body scanner with high spatial resolution in collaboration with United Imaging Healthcare (Shanghai, China), and a torso scanner with high timing resolution in collaboration with Philips (Andover, MA). In addition, Consortium efforts have included the development of two smaller-scale scanning devices: MiniEXPLORERs I and II. MiniEXPLORER I, built in collaboration with Siemens Medical solutions (Knoxville, TN), is currently being used to prototype total-body applications in non-human primates (Berg et al 2018). MiniEXPLORER II, the subject of this paper, is intended for use in companion animal veterinary and human brain imaging. Strategically, MiniEXPLORER II provides a system-level test-bench for the actual PET detectors, data acquisition system, data processing chain and acquisition software that will be used in the total-body EXPLORER scanner.
In this work, we describe the design of the MiniEXPLORER II scanner. We report its physical performance and results from the first in vivo study. The performance of the scanner indicates that components are working effectively and that systems integration has been successful.
2. System design
As shown in figure 1, the Mini EXPLORER II consists of a PET scanner and a standard 24-slice CT system (based on the uCT 510, United Imaging Healthcare, Shanghai, China). The CT scanner provides data for attenuation correction as well as for anatomical correlation.
Figure 1.
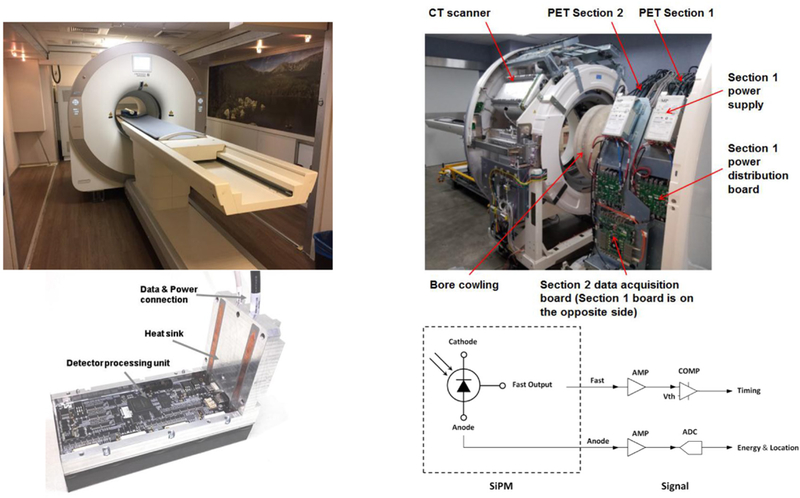
Scanner design. Top left: gantry as installed at UC Davis. Top right: gantry in factory with cover off, and PET and CT scanners separated. Bottom left: single PET detector module. Bottom right: diagram of the signal readout.
The CT scanner has a maximum rotation speed of 0.5 s/rotation. The CT detector has 24 physical detector rows with an axial extent of 19.2 mm and a minimum slice thickness is 0.6 mm. The x-ray tube has a focal spot of 0.5 mm × 1.0 mm, or 1.0 mm × 1.0 mm, with voltage variable from 80 kV to 140 kV. The tube current is variable from 10 mA to 420 mA.
The PET scanner has a ring diameter of 52 cm and an AFOV of 48.3 cm. It consists of two axial ‘sections’ with 16 detector modules each. The PET sections are mounted on rails and may be pulled apart from the CT scanner for maintenance access. Each PET section has its own power supply, power distribution board and data acquisition board. A coincidence processor on each data acquisition board receives single events from its own detector modules and can share single events with other coincidence processors. Thus ‘local coincidences’ may be generated by two singles from the same section and ‘inter-section coincidences’ may be generated by two singles from different sections. Such design facilitates the integration of multiple PET sections so as to extend the axial FOV of the PET scanner. The total-body EXPLORER PET scanner design is similar, but with eight sections of 24 detector modules each.
A photograph of a single detector module is shown in figure 1 (bottom left). Each module contains 5 × 14 detector blocks. Each block is an array of 6 × 7 LYSO scintillator crystals of size of 2.76 × 2.76 × 18.1 mm3, coupled to a 2 × 2 array of 6 × 6 mm2 J-series silicon photomultipliers (SiPM) (SensL, Cork, Ireland). The crystal pitch within a block is 2.85 mm. Additional details of the scanner design parameters are given in table 1. The gap between modules is approximately equal to the size of one crystal.
Table 1.
PET scanner design parameters.
| Ring diameter | 52 cm |
| Axial FOV | 48.3 cm |
| Photodetector | SensL J-series SiPM |
| Crystal material | LYSO |
| Crystal element size | 2.76 × 2.76 × 18.1 mm3 |
| Crystal pitch | 2.85 mm × 2.85 mm (axial × transaxial) |
| Crystals per block | 6 × 7 (axial × transaxial) |
| Block pitch | 17.17 mm × 20.03 mm (axial × transaxial) |
| Blocks per module | 14 × 5 (axial × transaxial) |
| Module pitch | 244 mm × 102 mm (axial × transaxial) |
| Number of modules | 2 × 16 (axial × circumferential) |
Each SiPM sensor has both a fast and a standard anode output as shown in figure 1 (bottom right). The fast signal from each sensor is amplified and then passed to a leading-edge discriminator which triggers to generate the arrival time of the incident annihilation photon. A time walk correction as described in Acconcia et al (2017) and Du et al (2017) has been implemented. The anode signal is amplified, digitalized and fed to an FPGA to get energy and position. The ADC is calibrated for linearity and any offsets. The crystal index is derived through mapping to a look-up table, which is generated as part of the calibration procedure and saved in the ROM. Finally, a valid single event is assigned with energy, time stamp, and position. The detector module output is fed to the local coincidence processing module which receives these single events and generates coincidences. These detectors are identical to those used in the total body EXPLORER scanner.
Subject set-up for human brain scanning is shown in figure 2. The CT bore diameter is 70 cm, while the PET bore diameter is 50 cm, giving sufficient clearance for the subject’s head to pass through the CT and be positioned at or near the center of the PET field of view.
Figure 2.

Left: diagram showing human subject positioning for brain imaging. Center: volunteer positioned for CT scanning. Right: volunteer positioned for PET scanning.
3. Methods
3.1. System performance
Unless otherwise specified, throughout this work PET data were acquired using 430 keV as the lower level discriminator (LLD), and an effective upper level discriminator of approximately 1000 keV. Two coincidence window widths were applied, 2.7 ns for coincidences within a section and 2.9 ns for inter-section coincidences. Coincidences were generated using a multiple-window approach with all geometrically valid coincidences between qualified singles accepted (Wang et al 2010).
3.1.1. Timing resolution
After time alignment (Lu 2016), a 22Na point source (activity ~1.11 MBq) was positioned at the center of FOV, and then LOR-based TOF histograms were obtained. The active size of the point source was smaller than 1 mm and was neglected in the timing resolution measurement. Data were acquired for approximately 4 h. The timing resolution was obtained through fitting a Gaussian function to each valid LOR-based TOF histogram.
3.1.2. Energy resolution
The energy information was obtained by accumulating the SiPM anode signals acquired in singles mode. After crystal position look-up-table calibration and energy response calibration, a 68Ge line source, 2 mm in diameter and 300 mm long, containing 2 mCi of activity, was positioned at the center of the FOV. Data were acquired for 30 min. Gaussian fits of the crystal-based energy spectra were generated and the energy resolutions were calculated as.
3.1.3. Count-rate response
Detector module count-rate response was measured by placing a NEMA NU-4 monkey-size scatter phantom at the center of the scanner. The line source in the phantom contained 503 MBq of 18F at the start of the measurement, and count rate data for each detector module were acquired over 9.4 half-lives. The actual detected single event rate for each detector module was estimated by linear extrapolation from the low-rate data. The amount of low-rate data included in the regression was determined using the method described in Badawi et al (2002)—in short, by adding data points until the r2 of the fit was maximized. The measured count rates and the rates estimated by linear extrapolation were fitted to a simple single exponential model (Eriksson et al 1994) using the following relationship:
where m is the measured count rate, n is the incident count rate, and τ is the characteristic dead time per event. The characteristic dead-time was determined based on the fit that led to the lowest mean-squared error for data up to a percent dead-fraction of 20%.
3.1.4. Sensitivity
Sensitivity was measured by following the NEMA NU 2–2012 standard (NEMA Standards Publication NU 2–2012 2012). The NEMA 70 cm-long polyethylene tube was filled with approximately 16 MBq of 18F-FDG prior to placing it inside the five specified concentric aluminum sleeves. The measurements were performed at the center of the FOV and at 100 mm radial offset.
3.1.5. Spatial resolution
Spatial resolution was measured using the NEMA NU 2–2012 standard. Three point sources were placed into a positioning fixture so that the data were simultaneously acquired at three transaxial locations: (0 mm, 10 mm), (100 mm, 0 mm), and (0 mm, 100 mm). The measurements were performed at the AFOV center and at 3/8 of the AFOV from the AFOV center. The sinogram was Fourier rebinned (FORE) and reconstructed with filtered backprojection (FBP) using a Ram-Lak filter. The image matrix was 801 × 801 with 0.3 × 0.3 mm2 pixel size. No attenuation and scatter correction and no post-smoothing filter were applied.
3.1.6. Noise-equivalent count rates (NECR)
NECR were determined using both the NEMA NU 4–2008 (NEMA Standards Publication NU 4–2008 2008) and NEMA NU 2–2012 standards.
3.1.7. CTperformance
The CT system was evaluated using the methods established by the American College of Radiology (ACR) for diagnostic CT systems (American College of Radiology 2017). The evaluation includes an assessment of system geometry, radiation output, and image quality. Four protocols were evaluated: an axial and helical acquisition of a small animal body as well as a vendor-provided adult and pediatric head protocol. Technique factors are summarized in table 2.
Table 2.
CT acquisition technique factors and reconstruction parameters.
| Protocol | Axial small body | Helical small body | Adult head | Pediatric head |
|---|---|---|---|---|
| Acquisition mode | Axial | Helical | Axial | Axial |
| Tube potential (kV) | 120 | 120 | 120 | 100 |
| Tube current (mA) | 150 | 188 | 160 | 250 |
| Rotation time (s) | 1 | 0.8 | 2 | 1 |
| Acquisition slice thickness (mm) | 1.2 | 1.2 | 1.2 | 1.2 |
| Reconstruction slice thickness (mm) | 2.4 | 2.4 | 4.8 | 4.8 |
| Manufacturer’s reconstruction kernel (iterative reconstruction strength) |
H_VSOFT_A, (KARL: 3) | B_VSOFT_A, (KARL: 3) | H_VSOFT_B, (KARL: 3) | H_VSOFT_B, (KARL: 3) |
3.2. PET image reconstruction
The PET reconstruction algorithm was 3D OP-LOR-OSEM (Dan 2004) with time of flight (TOF) and point spread function modeling (PSF) if not otherwise stated. We implemented a rotation-based projector for the purpose of parallel computing. The listmode data were sorted and stored as 280 separated files according to the projection angle. During the image reconstruction process, each file was sequentially loaded and rebinned into a raw sinogram of 559 radial bins, 168 × 168 slices and 11 TOF bins of 282 ps width. The raw sinogram was relatively sparse; therefore, it was compressed by removing the elements with zero counts.
The PSF was obtained from direct measurement. A point source was attached to a 3D stage allowing sampling of different parts of the field of view as follows: in the transaxial plane, 6862 positions were measured in a uniform grid across an isosceles triangle of height 187 mm and base 72 mm, with its vertex at the center of the FOV. The measured data were fitted using a 1D Gaussian function along the axial direction and a 2D Gaussian function in the transaxial plane, corresponding to the axial and transaxial components of the PSF (Rapisarda et al 2010). Variations in the axial PSF with axial position were not characterized.
The algorithm was coded in C++ and CUDA and implemented on a computer with dual six-core CPUs (Intel(R) Xeon(R) CPU E5–2630 v2 @2.60 GHz) and two NVIDIA Tesla K40cs. The reconstruction speed was recorded.
CT images were used for attenuation correction. The single scatter simulation (SSS) algorithm was used for scatter correction (Watson et al 1997), and the delayed events were used for random estimation. Normalization was performed using a component-based approach. The normalization factors were decomposed into trans-block profile, axial-block profile, crystal efficiency and plane efficiency. Trans-block profile and crystal efficiency were generated using the method proposed by Zhang et al (2008). Axial-block profile and plane efficiency were generated using the method proposed by Badawi and Marsden (1999). Time alignment correction was performed using the method described in Lu (2016). Dead time correction was conducted using an image-based method as follows: a cylinder water phantom filled with 370 MBq activity of 18F-FDG was scanned for about 10 half-lives. A series of images were reconstructed and the mean pixel values were recorded in accordance with the average block rate. The dead time correction factors were calculated by fitting the mean pixel values using a polynomial function. Corrections for decay and PET/CT spatial alignment were also applied.
3.3. Phantom studies
A long cylinder phantom was scanned for quantitative evaluation of image uniformity, and a mini-Derenzo phantom and a Hoffman phantom were scanned for qualitative evaluation of spatial resolution and image quality. All phantoms were positioned at the center of the PET FOV transaxially. The long cylinder phantom has a diameter of 150 mm and length of 500 mm. It was filled with ~56 MBq of 18F-FDG, and then scanned for 25 min (~1300 M prompts). The mini-Derenzo phantom was filled with ~11.1 MBq of 18F-FDG, and then scanned for 30 min (~580M prompts). The Hoffman phantom was filled with 31.8 MBq of 18F-FDG, and then scanned for 120 min (~3800 M prompts).
3.4. In vivo study
The first patient scanned at the UC Davis School of Veterinary Medicine was a 6 year-old, 11 kg Corgi dog (figure 3) that had a small peripheral nerve sheath tumor surgically excised from the left antebrachium two years previously, immediately followed by radiation therapy. The scan was performed to help characterize mild non-painful focal swelling of this region. The dog was injected with approximately 65 MBq of 18F-FDG and scanning was initiated after a 60 min uptake period. To ensure uniform sensitivity across the imaging field of view, three bed-positions were acquired, each of 12 min duration. Reconstruction and data corrections were performed as described in section 3.2.
Figure 3.
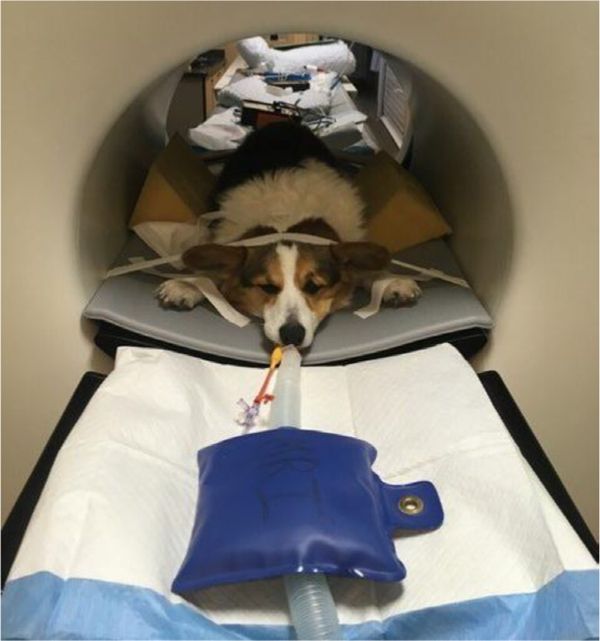
Anesthetized canine patient on the scanner bed.
4. Results
4.1. System performance
A flood-map from a single detector block created using Anger logic is shown in figure 4. All crystals are easily resolved. The average system energy resolution was found to be 11.7% ± 1.5% and the system timing resolution was found to be 409 ± 39 ps. The measured, fitted and extrapolated event rates of one of the detector modules are plotted as a function of activity in figure 5. The linear fit for all detector modules suggested a mean 176Lu background count-rate of 83.2 kcps with an LLD of 430 keV, which was in good agreement with direct measurements. The mean detector module characteristic dead-time (τ) per event using the single exponential dead-time model was 99.3 nanoseconds.
Figure 4.
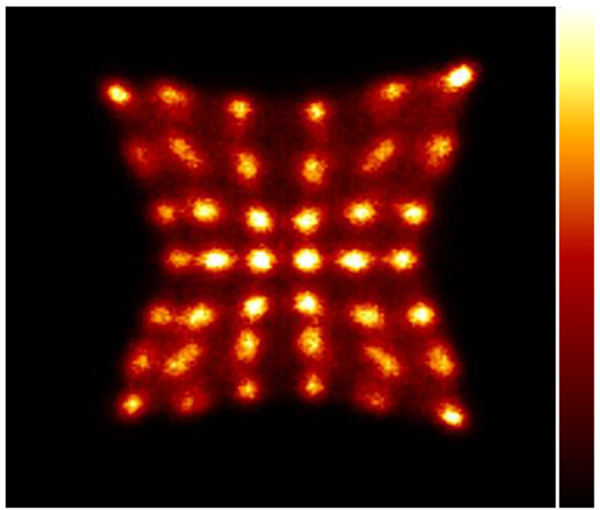
Flood map from a single detector block. Irradiation was provided by a 68Ge line source with approximately 1 mCi of activity placed at the center of the transaxial FOV.
Figure 5.
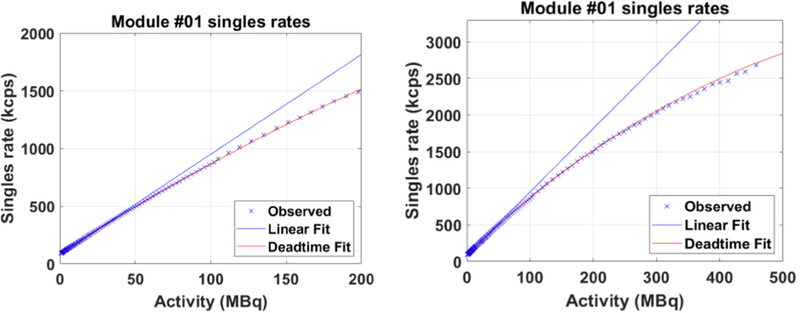
Count rate response for a single detector module exhibiting dead-time behavior close to the mean response. Left: for clinically relevant singles rates (Poon et al 2012). Right: over the entire experimental range. The r2 for the linear fit was >0.9999. The characteristic dead-time for the single exponential fit was 99 nanoseconds.
The NEMA NU 2–2012 system sensitivities were 51.8 and 53.6 kcps MBq−1 at 0 cm and 10 cm off-center, respectively. No correction for the 18F branching ratio was applied. The average spatial resolution at 10 mm from the center of the FOV was 2.61 mm FWHM. The peak NECR by the NU 2–2012 standard was measured to be 314 kcps at 9.2 kBq cc−1 with a corresponding scatter fraction of 43.5%. Using the NU 4–2008 standard, the peak NECR was 1712 kcps at 56 kBq cc−1 with the scatter fraction of 18.9%. Plots of different events rates as trues, randoms, scatter as well as NECR and scatter fraction are shown in figure 8. As expected (due to the smaller phantom size), a higher NECR peak and lower scatter fraction were observed by using NU4–2008 standard.
Figure 8.
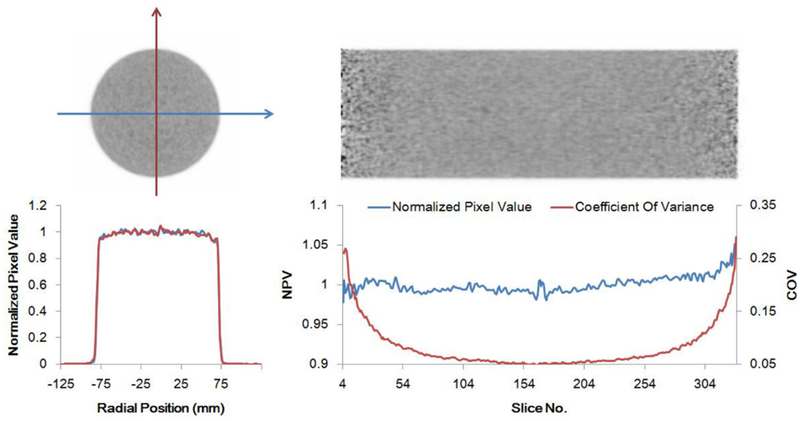
15 cm × 50 cm uniform cylinder scan. Top: axial and coronal PET images. Bottom left: orthogonal transaxial normalized pixel intensity profiles. Bottom right: axial central normalized pixel intensity profile (blue) and pixel coefficient of variance (red) demonstrating the level of axial uniformity.
NEMA sensitivity and event rates are shown graphically in figure 6. System design and performance parameters are summarized in table 3, and the results of spatial resolution measurements are shown in table 4.
Figure 6.

NEMA sensitivity and event rate results. Left: NU-2–2012 sensitivity; corrections for the branching ratio of 18F were not applied. Center: event rates and scatter fractions from NU2–2012 test. Right: event rates and scatter fractions from NU4–2008 test.
Table 3.
Performance parameters for mini EXPLORER II.
| Timing resolution | 409 ± 39 ps |
| Energy resolution | 11.7% ± 1.5% |
| Characteristic dead-time per event for a single module | 99 ns |
| NECR peak (NEMA NU4–2008) | 1712 kcps at 56 kBq cc−1 |
| Scatter fraction (NEMA NU4–2008) | 18.9% |
| NECR peak (NEMA NU2–2012) | 314 kcps at 9.2 kBq cc−1 |
| Scatter fraction (NEMA NU2–2012) | 43.5% |
| Sensitivity (NEMA NU2–2012) | 51.8 kcps MBq−1 at 0 cm |
| 53.6 kcps MBq−1 at 10 cm |
Table 4.
Spatial resolution (NEMA NU 2–2012) for MINI EXPLORER II.
| (0, 10) mm FWHM |
(100, 0) mm FWHM |
(0, 100) mm FWHM |
|||||||
|---|---|---|---|---|---|---|---|---|---|
| Axial position | R | T | A | R | T | A | R | T | A |
| 1/2AFOV | 2.62 | 2.88 | 2.61 | 3.32 | 3.75 | 3.14 | 3.28 | 3.25 | 3.03 |
| 3/8AFOV | 2.43 | 2.69 | 2.46 | 3.12 | 3.45 | 2.96 | 3.62 | 3.10 | 2.68 |
R, T and A are for radial, tangential and axial resolutions, respectively.
The CT component of the system met all ACR performance requirements for a diagnostic head CT imaging system. The CTDIvol for these exam protocols (see table 5) were well below the ACR limit for a diagnostic head CT (80 mGy for adults, 40 mGy for pediatrics). Due to the small bore size, the CTDIvol for the 32 cm phantom was not directly measured but it could be approximated as ½ of the CTDIvol measured for a 16 cm phantom. In terms of image quality, the contrast-to-noise ratio (CNR) was measured to be 1.3 for both the helical an axial small animal body protocols. The CNR was 1.4 for the adult head protocol and 0.9 for the pediatric head protocol (see table 5 and figure 7). These CNR values are well within the diagnostic range.
Table 5.
CTDIvol and image noise statistics for Module 2 of the ACR phantom.
| Axial small animal body |
Helical small animal body |
Adult head | Pediatric head | |
|---|---|---|---|---|
| Rod mean | 76.82 | 92.5 | 77.35 | 67.25 |
| Background mean | 72.15 | 86.56 | 73.61 | 63.89 |
| Background standard deviation | 3.75 | 4.45 | 2.71 | 3.63 |
| CNR | 1.25 | 1.33 | 1.38 | 0.93 |
| CTDIvol (mGy), 16 cm phantom | 23 | 20.8 | 46.9 | 21.9 |
Figure 7.
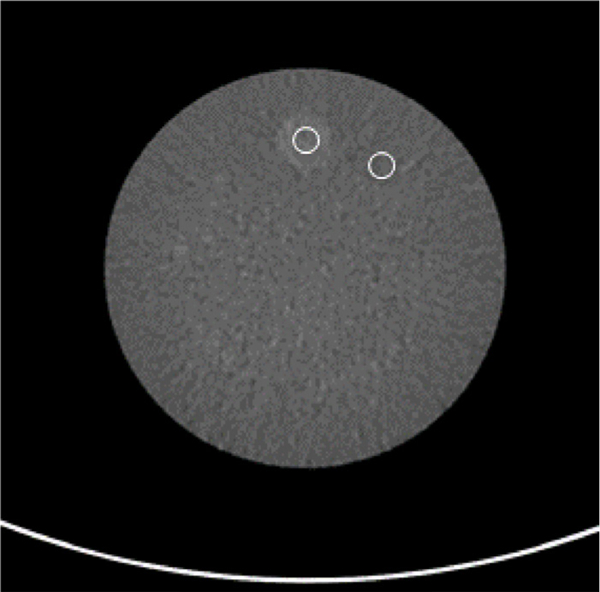
Module 2 of the ACR phantom with an ROI over the signal and background of the phantom. Both ROIs were placed at a fixed radius. This method was repeated for all four acquisitions. The measurements are shown in table 5.
4.2. PET image reconstruction
For an image matrix of size 499 × 499 × 336, the processing speed using the rotating projector and the computing platform described above was 7.9 million events per second, rising to 22.1 million events per second for an image matrix of size 249 × 249 × 336.
4.3. Phantom images
Transaxial and axial images of the long cylinder phantom, together with profiles through them are shown in figure 8. The outermost three slices at each end were excluded from the analysis. The root mean square error of the pixel values compared to the mean value of each axial slice was 0.96%. No major artifacts are seen in the images. Three iterations and 20 subsets were used for the reconstruction.
The mini-Derenzo phantom image with no post-reconstruction filtering is shown in figure 9. The pixel size is 0.6 × 0.6 mm2. The rod diameter of the mini-Derenzo phantom ranges from 1.6 mm to 3.6 mm. It can be seen that the 2.4 mm rods are clearly resolved and the 2.0 mm rods are partially resolved.
Figure 9.
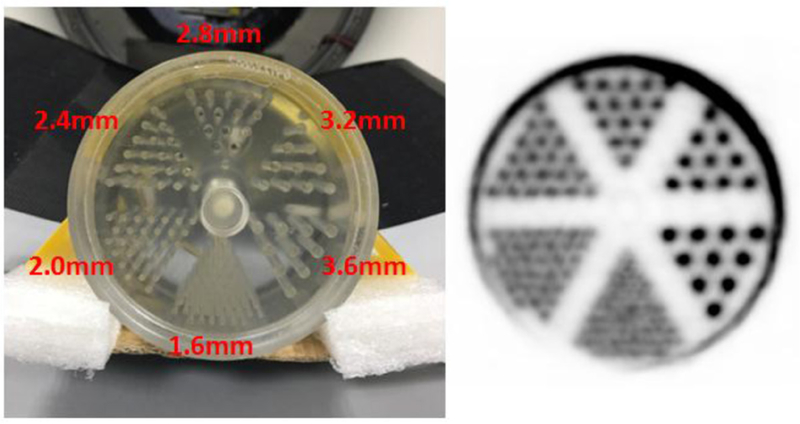
PET images of the mini-Derenzo phantom. Left: photograph showing rod diameters. Right: reconstruction with the rotating projector (3 iterations and 20 subsets). The reconstructed pixel size is 0.6 mm × 0.6 mm.
The reconstructed image of the Hoffman phantom is shown in figure 10, together with the CT image. A 2 mm 2D-Gaussian filter was applied to the reconstructed image. The voxel size is 1.2 × 1.2 × 1.43 mm3. Reconstruction was performed using ten iterations and 20 subsets. In the PET image, the fine structure of the cerebral sulci and gyri are well-visualized and it is possible to distinguish between the white matter and the ventricles.
Figure 10.
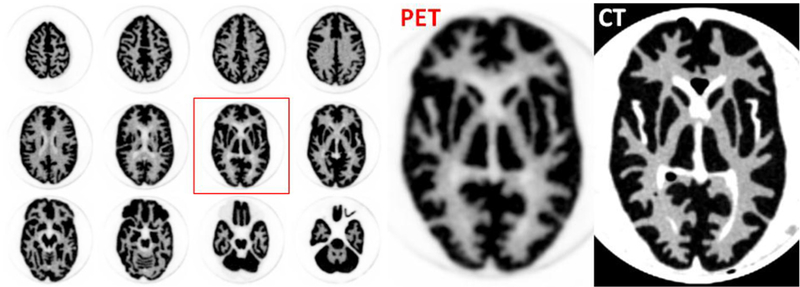
PET images (left and center) and CT images (right) of a Hoffman brain phantom. The pixel size of the PET image is 1.2 mm × 1.2 mm. Reconstruction was performed with 10 iterations and 20 subsets.
4.4. Animal study
Images of the canine patient are shown in figure 11. Overall image quality is excellent. Images at the site of previous peripheral nerve sheath tumor excision and radiation therapy revealed moderate diffuse iodinated contrast medium uptake in the antebrachial musculature (figure 12(a)) and corresponding mild FDG uptake (figure 12(b)). Biopsy of the site confirmed a Grade I perivascular wall tumor which was thought to have been radiation induced.
Figure 11.
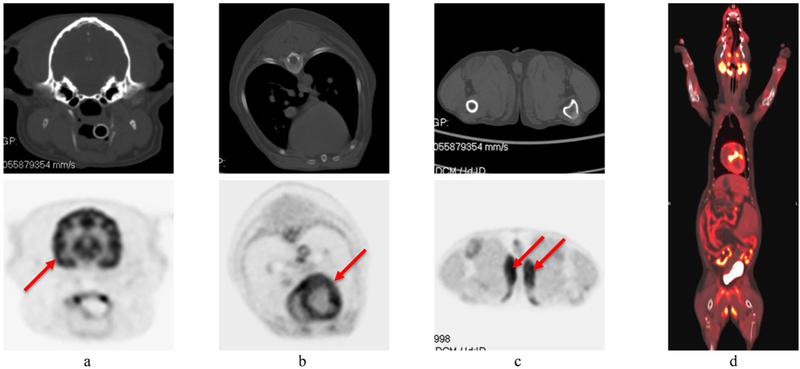
CT (upper row) and PET (lower row) images of the first canine patient. (a) head (arrow indicates normal grey matter uptake); (b) thorax (arrow indicates normal myocardial uptake); (c) proximal pelvic limbs (arrows indicate unexpected bilateral uptake in the gracilis muscles); (d) representative PET/CT overlay image.
Figure 12.

Zoomed image of the left antebrachial region from the first canine patient. (a) CT image (arrow indicates moderate diffuse iodinated contrast enhancement); (b) PET image (arrow indicates mild FDG uptake); (c) PET/CT overlay image.
5. Discussion
The EXPLORER Consortium’s efforts to build small-scale prototype scanners are intended to serve several purposes: (1) to explore issues and limitations arising from large acceptance angle imaging with detectors appropriate for human-scale scanners; (2) to prototype applications in animals that can be translated to humans; and (3) to prototype systems integration for the hardware and software components of the human-scale system. The first area was addressed in part in work with the MiniEXPLORER I scanner, which also continues to offer opportunities in area 2 (Abstracts of the total body PET conference 2018 2018, Berg et al 2018). MiniEXPLORER II is primarily aimed at the third purpose in this list and this goal has been successfully achieved. However, it also presents opportunities to address items 1 and 2, and further, to provide a platform for clinical veterinary applications, for investigations in comparative medicine with companion animals, and for high-performance human brain imaging.
In terms of addressing possible limitations with regard to large acceptance angle imaging, the MiniEXPLORER II results are reassuring with regard to matters relating to image uniformity and spatial resolution. Figure 8 demonstrates that no significant artifacts are apparent in a 20 cm diameter uniform cylinder with length adequate to encompass the entire AFOV. Figure 9 demonstrates excellent spatial resolution even with all lines of response accepted—a result that is in agreement with what was seen with MiniEXPLORER I (Berg et al 2018).
With regard to prototyping studies that can be translated to humans, this is an area of ongoing work. We are particularly interested in cardiovascular applications where animal models of choice include rabbits (Vucic et al 2011). Historically, PET imaging with rabbits has been challenging as they are too large for conventional small animal scanners, but too small to be optimally imaged by general-purpose clinical scanners, which are designed for use with adult humans. For veterinary care and for comparative medicine research, the animals in question (typically dogs and cats), as with rabbits, again are too large for small animal scanners, and are frequently too small to be well-served by clinical scanners. MiniEXPLORER II offers a very high sensitivity and high spatial resolution solution to this problem.
Human brain imaging is also an interesting possibility. In recent years, most major manufacturers have left the marketplace for dedicated, high-performance brain PET scanners and today, most neuroPET studies are performed on general-purpose devices. Dedicated brain PET is now primarily performed either on the aging fleet of Siemens HRRTs (Eriksson et al 2002) or on the small number of dedicated brain PET/MRI devices (Kolb et al 2012). However, there has been a recent resurgence of interest in dedicated PET brain imaging (e.g. Yamaya et al (2008b), Yamamoto et al (2011), Isobe et al (2012), Kolb et al (2012) and Grogg et al (2016)), partly driven by the need to prototype simultaneous PET/MR technology (Kolb et al 2012), partly by the approval of new radiotracers in the USA (e.g. Vandenberghe et al (2010), Barthel et al (2011) and Clark et al (2012)), and partly by additional investments in neuroscience research by the National Institutes for Health (Insel et al 2013), the European Union (Markram et al 2011), China and other countries across the world (Huang and Luo 2015). MiniEXPLORER II has the potential to play a significant role in this resurgence.
6. Conclusion
We have constructed a fully-functioning high-sensitivity PET/CT scanner that has potential for human brain imaging, and whole body clinical veterinary care and comparative research in companion animals. The scanner has facilitated component and system-level prototyping for the first EXPLORER total-body PET scanner. The PET system performance was evaluated in accordance with the NEMA NU 2–2012 and NEMA NU 4–2008 standards, and the CT performance was evaluated using ACR recommendations. Phantom and in vivo images have been acquired. Key performance parameters include spatial resolution of 2.6 mm and NEMA NU2–2012 sensitivity at the center of the field of view of 5.2%.
Acknowledgments
This work was supported in part by NIH Grant R01CA206187. We would like to thank the Center for Imaging Sciences at the School of Veterinary Medicine of UC Davis for technical support. The author’s have confirmed that any identifiable participants in this study have given their consent for publication.
References
- Acconcia G, Cariaggi D, Labanca I, Rech I and Ghioni M 2017. Improving the timing accuracy of SiPMs by time-walk compensation Electron. Lett. 53 171–3 [Google Scholar]
- American College of Radiology 2017. CT Quality Control Manual (Reston, VA: ACR; ) [Google Scholar]
- Badawi RD et al. 2002. Count-rate dependent event mispositioning and NEC in PET IEEE Nuclear Science Symp. Conf. Record vol 2 pp 1182–7 [Google Scholar]
- Badawi RD, Kohlmyer SG, Harrison RL, Vannoy SD and Lewellen TK 2000. The effect of camera geometry on singles flux, scatter fraction and trues and randoms sensitivity for cylindrical 3D PET-a simulation study IEEE Trans. Nucl. Sci. 47 1228–32 [Google Scholar]
- Badawi RD and Marsden PK 1999. Developments in component-based normalization for 3D PET Phys. Med. Biol. 44 571–94 [DOI] [PubMed] [Google Scholar]
- Barthel H et al. 2011. Cerebral amyloid-β PET with florbetaben (18 F) in patients with Alzheimer’s disease and healthy controls: a multicentre phase 2 diagnostic study Lancet Neurol. 10 424–35 [DOI] [PubMed] [Google Scholar]
- Berg E et al. 2018. Development and evaluation of mini-EXPLORER: a long axial field-of-view PET scanner for non-human primate imaging J. Nucl. Med. 59 993–8 [DOI] [PMC free article] [PubMed] [Google Scholar]
- Berg E, Li E, Zhang X, Williams S, Tarantal AF, Badawi RD and Cherry SR 2018. Abstracts of the total body PET conference 2018 EJNMMI Phys. 5 19. [DOI] [PMC free article] [PubMed] [Google Scholar]
- Cherry SR 2006. The 2006 Henry N. Wagner Lecture: of mice and men (and positrons)--advances in PET imaging technology J. Nucl. Med. 47 1735–45 [PubMed] [Google Scholar]
- Cherry S, Badawi R, Karp J, Moses W, Price P and Jones T 2017. Total-body imaging: transforming the role of Positron Emission Tomography Sci. Trans. Med. 9 eaaf6169 [DOI] [PMC free article] [PubMed] [Google Scholar]
- Cherry SR, Jones T, Karp JS, Qi J, Moses WW and Badawi RD 2018. Total-Body PET: maximizing sensitivity to create new opportunities for clinical research and patient care J. Nucl. Med 59 3–12 [DOI] [PMC free article] [PubMed] [Google Scholar]
- Clark CM et al. 2012. Cerebral PET with florbetapir compared with neuropathology at autopsy for detection of neuritic amyloid-β plaques: a prospective cohort study Lancet Neurol. 11 669–78 [DOI] [PubMed] [Google Scholar]
- Conti M et al. 2006. Performance of a high sensitivity PET scanner based on LSO panel detectors IEEE Trans. Nucl. Sci. 53 1136–42 [Google Scholar]
- Couceiro M, Ferreira NC and Fonte P 2007. Sensitivity assessment of wide axial field of view PET systems via monte carlo simulations of NEMA-like measurements Nucl. Instrum. Methods Phys. Res. A 580 485–8 [Google Scholar]
- Dan JK 2004. LOR-OSEM: statistical PET reconstruction from raw line-of-response histograms Phys. Med. Biol. 49 4731–44 [DOI] [PMC free article] [PubMed] [Google Scholar]
- Du J, Schmall JP, Judenhofer MS, Di K, Yang Y and Cherry SR 2017. A time-walk correction method for PET detectors based on leading edge discriminators IEEE Trans. Radiat. Plasma Med. Sci. 1 385–90 [DOI] [PMC free article] [PubMed] [Google Scholar]
- Eriksson L et al. 2002. The ECAT HRRT: NEMA NEC evaluation of the HRRT system, the new high-resolution research tomograph IEEE Trans. Nucl. Sci. 49 2085–8 [Google Scholar]
- Eriksson L et al. 2008. Potentials for large axial field of view positron camera systems IEEE Nuclear Science Symp. Conf. Record pp 1632–6 [Google Scholar]
- Eriksson L, Wienhard K and Dahlbom M 1994. A simple data loss model for positron camera systems IEEE Trans. Nucl. Sci. 41 1566–70 [Google Scholar]
- Grogg KS et al. 2016. National electrical manufacturers association and clinical evaluation of a novel brain PET/CT scanner J. Nucl. Med. 57 646–52 [DOI] [PMC free article] [PubMed] [Google Scholar]
- Huang ZJ and Luo L 2015. It takes the world to understand the brain Science 350 42–4 [DOI] [PMC free article] [PubMed] [Google Scholar]
- Insel TR, Landis SC and Collins FS 2013. The NIH BRAIN initiative Science 340 687–8 [DOI] [PMC free article] [PubMed] [Google Scholar]
- Isobe T et al. 2012. Development of a new brain PET scanner based on single event data acquisition IEEE Nuclear Science Symp. Conf. Record pp 3540–3 [Google Scholar]
- Kolb A et al. 2012. Technical performance evaluation of a human brain PET/MRI system Eur. Radiol. 22 1776–88 [DOI] [PubMed] [Google Scholar]
- Lu X 2016. An accurate PET time calibration method with phantom position correction J. Nucl. Med. 57 1945 [Google Scholar]
- Markram H et al. 2011. Introducing the human brain project Procedia Comput. Sci. 7 39–42 [Google Scholar]
- NEMA Standards Publication NU 2–2012 2012. Performance Measurements of Positron Emission Tomographs (PETs) (Rosslyn, VA: National Electrical Manufacturers Association; ) [Google Scholar]
- NEMA Standards Publication NU 4–2008 2008. Performance Measurements of Small Animal Positron Tomography (Rosslyn, VA: NationalElectrical Manufacturers Association; ) [Google Scholar]
- Poon JK 2013. The performance limits of long axial field of view PET scanners PhD Thesis (Davis, CA: University of California at Davis) [Google Scholar]
- Poon JK et al. 2012. Optimal whole-body PET scanner configurations for different volumes of LSO scintillator: a simulation study Phys. Med. Biol. 57 4077. [DOI] [PMC free article] [PubMed] [Google Scholar]
- Rapisarda E, Bettinardi V, Thielemans K and Gilardi MC 2010. Image-based point spread function implementation in a fully 3D OSEM reconstruction algorithm for PET Phys. Med. Biol. 55 4131. [DOI] [PubMed] [Google Scholar]
- Vandenberghe R et al. 2010. 18F-flutemetamol amyloid imaging in Alzheimer disease and mild cognitive impairment: a phase 2 trial Ann. Neurol. 68 319–29 [DOI] [PubMed] [Google Scholar]
- Vucic E et al. 2011. Pioglitazone modulates vascular inflammation in atherosclerotic rabbits noninvasive assessment with FDG-PET-CT and dynamic contrast-enhanced MR imaging JACC Cardiovasc. Imaging 4 1100–9 [DOI] [PMC free article] [PubMed] [Google Scholar]
- Wang C et al. 2010. A real time coincidence system for high count-rate TOF or non-TOF PET cameras using hybrid method combining AND-Logic and time-mark technology IEEE Trans. Nucl. Sci. 57 708–14 [DOI] [PMC free article] [PubMed] [Google Scholar]
- Watanabe M et al. 2004. A high-throughput whole-body PET scanner using flat panel PS-PMTs IEEE Trans. Nucl. Sci. 51 796–800 [Google Scholar]
- Watson CC, Newport D, Casey ME, DeKemp RA, Beanlands RS and Schmand M 1997. Evaluation of simulation-based scatter correction for 3-D PET cardiac imaging IEEE Trans. Nucl. Sci. 44 90–7 [Google Scholar]
- Wong W-H, Zhang Y, Liu S, Baghaei H, Ramirez R and Liu J 2007. The initial design and feasibility study of an affordable high-resolution 100 cm long PET IEEE Nuclear Science Symp. Conf. Record pp 4117–22 [Google Scholar]
- Yamamoto S, Honda M, Oohashi T, Shimizu K and Senda M 2011. Development of a brain PET system, PET-hat: a wearable PET system for brain research IEEE Trans. Nucl. Sci. 58 668–73 [Google Scholar]
- Yamaya T et al. 2008a. A proposal of an open PET geometry Phys. Med. Biol. 53 757–73 [DOI] [PubMed] [Google Scholar]
- Yamaya T, Yoshida E, Obi T, Ito H, Yoshikawa K and Murayama H 2008b. First human brain imaging by the jPET-D4 prototype with a pre-computed system matrix IEEE Trans. Nucl. Sci. 55 2482–92 [Google Scholar]
- Yoshida E et al. 2013. Feasibility study of an axially extendable multiplex cylinder PET IEEE Trans. Nucl. Sci. 60 3227–34 [Google Scholar]
- Zhang Y et al. 2008. A new self-normalization method for PET J. Nucl. Med. 49 62 [Google Scholar]


