
Figure 8.
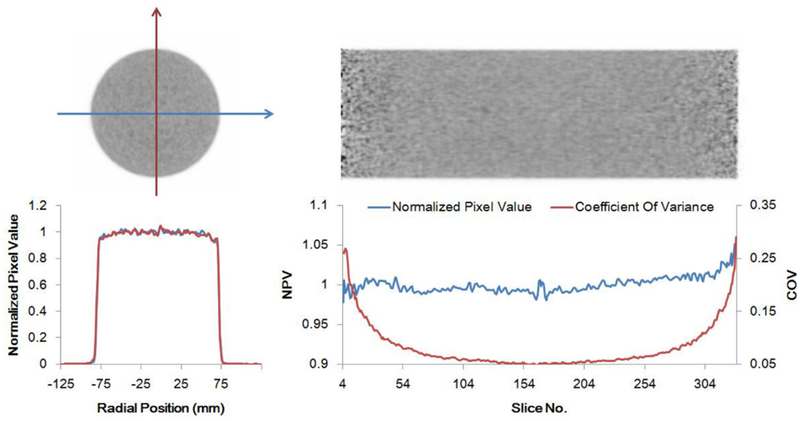
15 cm × 50 cm uniform cylinder scan. Top: axial and coronal PET images. Bottom left: orthogonal transaxial normalized pixel intensity profiles. Bottom right: axial central normalized pixel intensity profile (blue) and pixel coefficient of variance (red) demonstrating the level of axial uniformity.