
Figure 1.
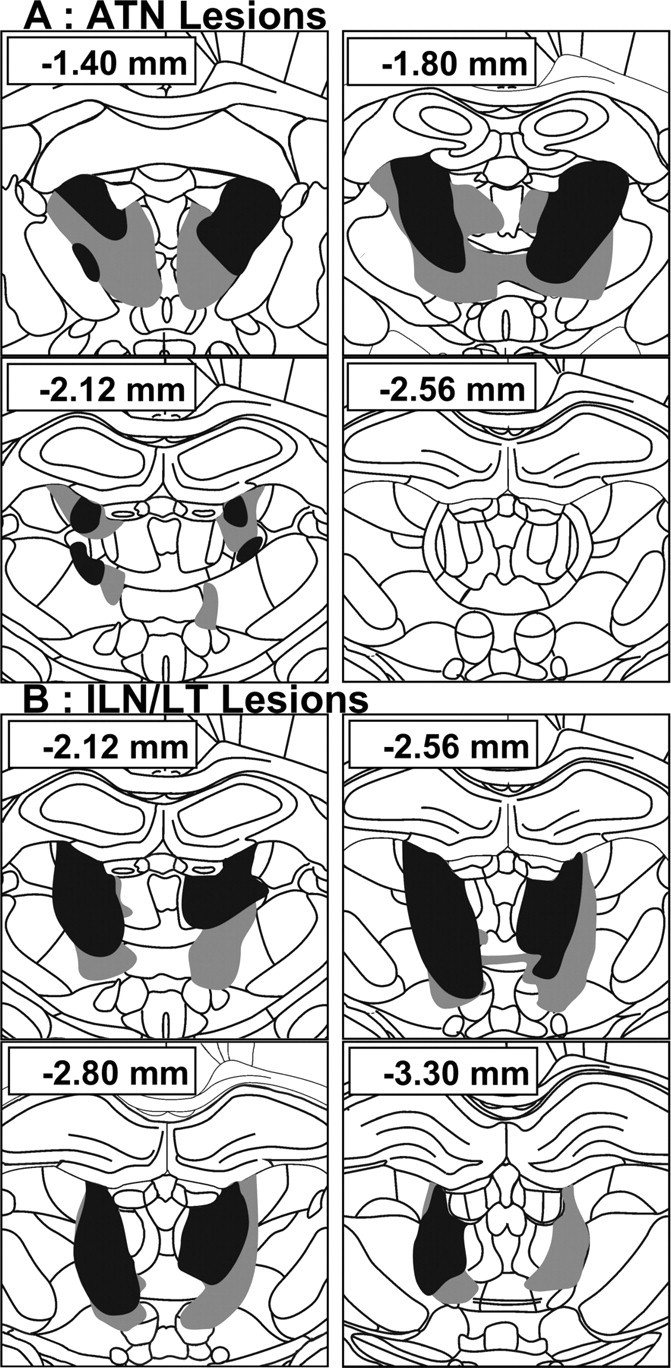
Schematic representation of the smallest (black) and largest (gray) thalamic lesions. A, Anterior thalamic nuclei group (ATN). B, Intralaminar nucleus/lateral thalamic lesion group (ILN/LT). Numbers (in mm) indicate the distance of each section from bregma (according to Paxinos and Watson, 1998).