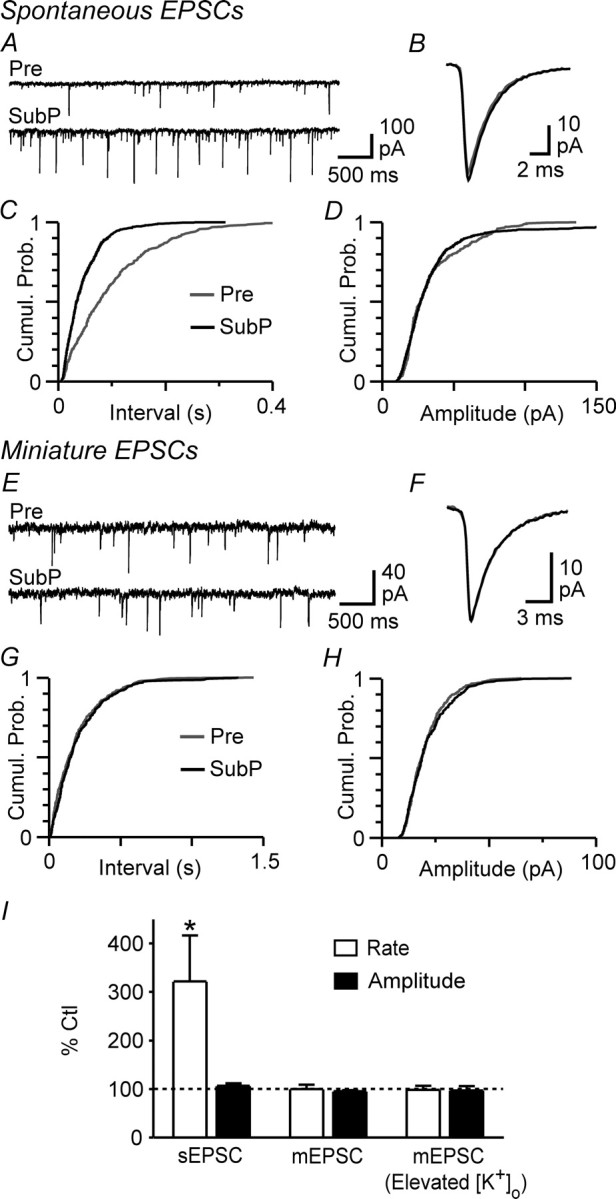
Figure 5.

Substance P increases the frequency of action potential-dependent spontaneous EPSCs. A, Representative raw traces of spontaneous EPSCs before (Pre) and during superfusion of substance P (SubP, 300 nm). B, Averaged traces of spontaneous EPSCs before and during substance P. C, D, Cumulative probability (Cumul. Prob.) distribution plots of spontaneous EPSC versus inter-event interval (C) and amplitude (D) before (Pre) and during substance P. E, Representative raw traces of spontaneous miniature EPSCs before (Pre) and during substance P. F, Averaged traces of miniature EPSCs before and during substance P. G, H, Cumulative probability (Cumul. Prob.) distribution plots of miniature EPSC versus inter-event interval (C) and amplitude (D) before (Pre) and during substance P. I, Bar chart of the mean rate and amplitude of spontaneous EPSCs (sEPSCs) and miniature EPSCs (mEPSCs) in the presence of substance P, expressed as a percentage of the predrug control (Ctl) level, in neurons preincubated in standard (2.5 mm) and elevated (17.5 mm; Elevated [K+]o) extracellular [K+]. *p < 0.05. A–D are taken from one neuron and E–H from a different neuron in 17.5 mm [K+]o.
