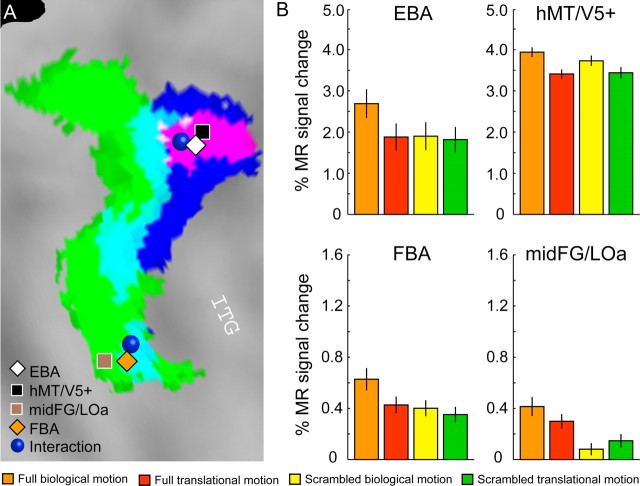
Figure 5.
ROI analysis. A, Activations for the main effects and the interaction projected onto a flattened right hemisphere of the PALS atlas (same color code as in Fig. 3D). The symbols indicate the position (group analysis) of the human MT/V5 complex (48, −72, −4), the EBA (52, −70, −4), the FBA (42, −42, −26), the mid-FG/LOa (36, −38, −24), and the two local maxima of the interaction in experiment 1. B, Activity profiles for the four ROIs computed on nonsmoothed data and averaged (± SEM) over subjects. Detailed statistics are shown in Table 2.

