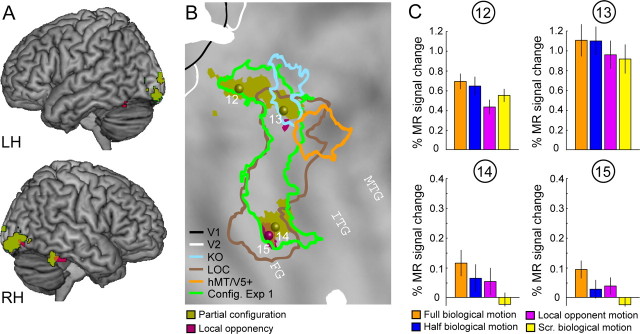
Figure 9.
Results of experiment 3. A, B, t score maps thresholded at p < 0.001, uncorrected, for the main effects of partial configuration (olive) and local opponency (burgundy) projected onto a rendered brain and a flattened right hemisphere of the PALS atlas. The symbols indicate the position of the four local maxima reaching significance at corrected level (FDR), listed in Table 1. The colored outlines indicate the location (group analysis) of the KO area (blue), the hMT/V5+ (orange), the LOC (brown), and the main effect of configuration obtained from experiment 1 (Config. Exp 1; green). C, Activity profiles (± SEM) for the four local maxima indicated in B. Scr., Scrambled.

