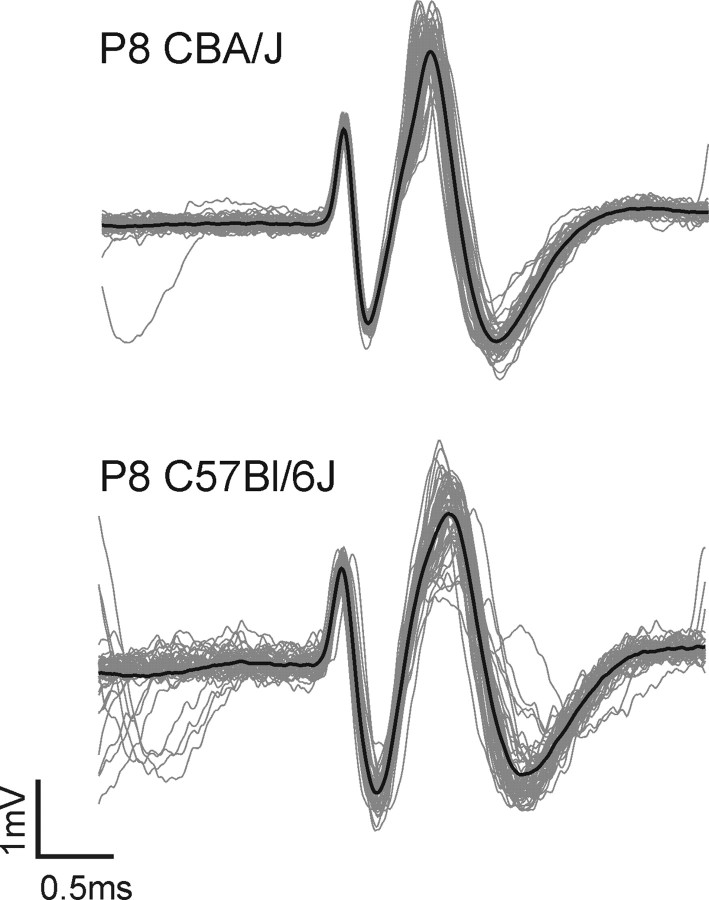
Figure 1.
Compound waveforms of MNTB units from a CBA/J mouse (upper graph) and a C57BL/6J mouse (lower graph). Each graph shows 50 superimposed waveforms (black line, mean waveform) of a P8 single-unit during spontaneous discharge activity aligned at the positive peak of the first component which shows the activity of the presynaptic calyx terminal. The second component corresponds to the action potential of the postsynaptic cell. Similar compound waveforms were found at all postnatal ages studied, though the amplitude ratio between presynaptic and postsynaptic components may vary.

