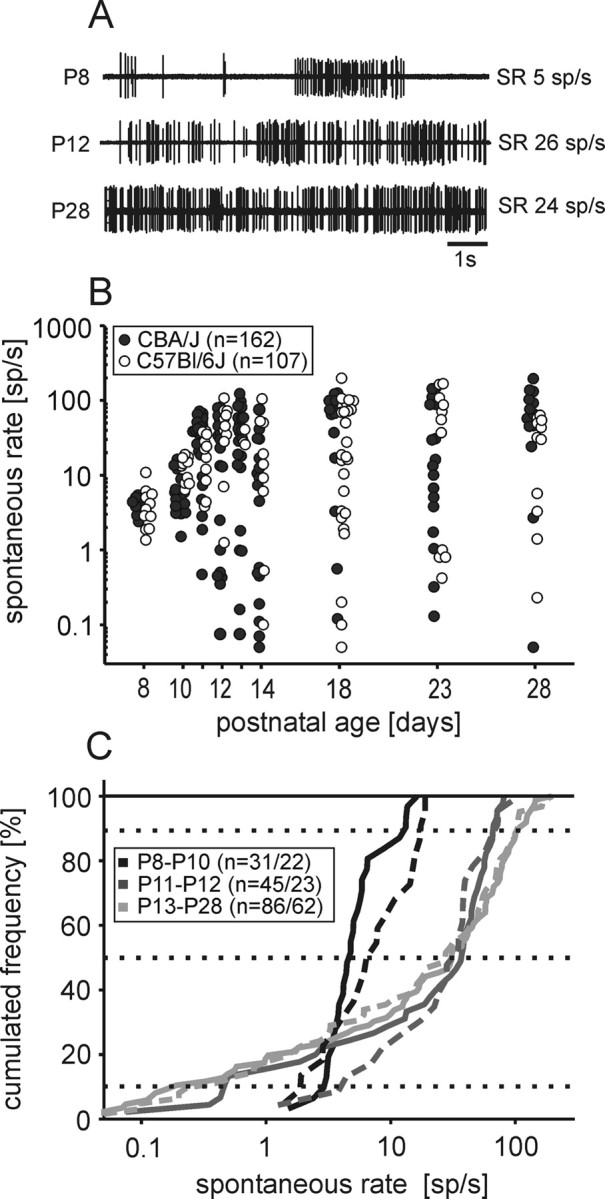
Figure 2.

Development of spontaneous activity. A, Exemplary traces (10 s excerpts) of spontaneous discharges at three ages (P8, P12, P28). B, Spontaneous rates of single units. The range of spontaneous rates increased during development, both in CBA/J mice (filled circles, p < 0.001, ANOVA on ranks) and C57BL/6J mice (open circles, p < 0.001, ANOVA on ranks). The number of units recorded in each age group varied between 10 and 26 in CBA/J mice and between 3 and 28 in C57BL/6J mice. C, Cumulated distribution of spontaneous rates at different ages with marks of the respective medians (50%) and interdecile ranges (10–90%). In prehearing mice (P8–P10), units showed low spontaneous discharge rates (1–20 spikes/s). At P11–P12 and P13–P28, the values expanded both to lower (<1 spikes/s) and higher (maximum 200 spikes/s) rates. There was no significant difference between CBA/J (solid lines) and C57BL/6J mice (dashed lines); the respective numbers of units are indicated as follows: n = #CBA/#C57BL.
