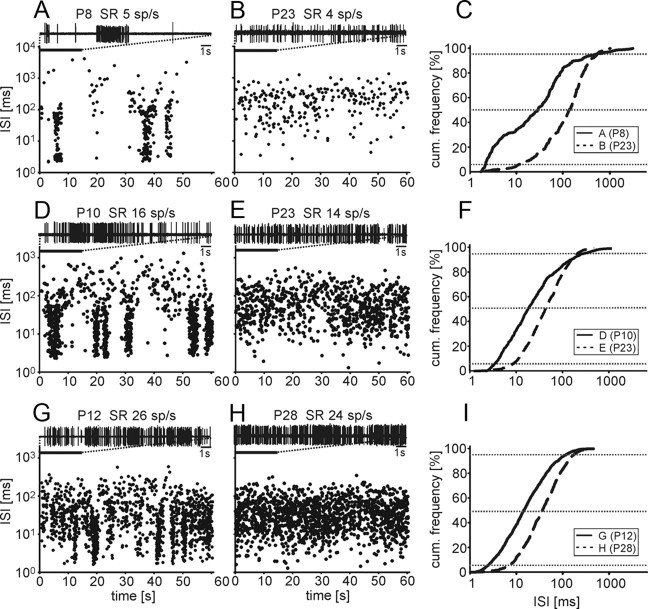
Figure 3.
Patterns of spontaneous discharge activity. The distribution of ISIs for 60 s of spontaneous spike discharges and 15 s excerpts of the original spike trains (on top of each graph) of six exemplary single units (3 pairs with comparable spontaneous rates indicated above the respective graphs) is shown; bursting units are on the left side, nonbursting units in the middle, and cumulated distributions of ISI of the respective pairs of units on the right side. In units of prehearing mice and in some units of P11 and P12 mice, spontaneous spikes were grouped in bursts indicated by periods of increased spike rate embedded in silent periods or in periods of reduced discharge activity (A, D, G). Within the bursts, ISIs were mostly in the range of 2–100 ms. From P13 to P28, bursting was never observed and spike discharges were more continuous (B, E, H). The cumulated distributions of ISI of the six units (C, F, I) shows that the median values (middle dotted line) of ISIs in bursting units are always smaller than in nonbursting units with comparable discharge rates. Still, the extremes of the range of ISIs in the two groups as indicated by the 5th and 95th percentiles (upper and lower dotted lines) are mostly in the same range.

